
Commands
In this guide, we’ll walk you through the process of setting up a Caddy server using Podman, empowering you to host your websites with confidence.


This guide aims to equip you with the knowledge needed to install ELK stack on RHEL9 | CentOS9 effortlessly. By following these steps, you can harness the power of Elasticsearch, Logstash, and Kibana to streamline your data management and analysis processes.
💡NOTE: This article covers the most recent releases of Elasticsearch, Logstash, and Kibana, which, as of the publication date, are version 8.12.2. |
In today’s data-driven world, businesses rely heavily on robust and efficient tools to manage and analyze vast amounts of data. The ELK stack, comprised of Elasticsearch, Logstash, and Kibana, is a powerful open-source solution designed to streamline the process of log management and analysis. In this guide, we will walk you through the step-by-step process of installing the ELK stack on RHEL 9 | CentOS 9.
Before diving into the installation process, let’s take a moment to understand each component of the ELK stack and its role in the data management and analysis pipeline.
Kibana | Kibana is a powerful visualization and exploration tool that complements Elasticsearch by providing a user-friendly interface for querying, analyzing, and visualizing data. It offers a wide range of interactive visualizations, including charts, graphs, maps, and dashboards, allowing users to gain valuable insights into their data through intuitive and customizable displays. Kibana’s rich set of features enables users to create ad-hoc queries, build complex aggregations, and generate dynamic reports to support data-driven decision-making across the organization. |
Elasticsearch | Elasticsearch is a distributed, RESTful search engine built on top of Apache Lucene. It provides a scalable platform for storing, searching, and analyzing large volumes of data in real-time. Elasticsearch uses a document-oriented approach to store data, making it highly flexible and efficient for a wide range of use cases. It offers powerful search capabilities, including full-text search, aggregations, and geospatial search, making it an ideal choice for applications requiring fast and accurate data retrieval. |
Logstash | Logstash is a dynamic data collection pipeline tool that allows you to ingest, transform, and enrich data from various sources before storing it in Elasticsearch for analysis. It supports a wide range of input sources, including log files, syslog, beats, and other data streams, making it versatile and adaptable to diverse data environments. Logstash enables you to parse and structure incoming data using filters, apply transformations and enrichments, and route it to different output destinations, such as Elasticsearch, Kafka, or other storage systems. |
Filebeat | Filebeat is a lightweight data shipper designed to efficiently collect, parse, and forward log files and other data streams to Elasticsearch or Logstash for further processing. It simplifies the process of ingesting data from servers, containers, and other sources by monitoring specified log files and directories in real-time and shipping the data to the configured output destinations. Filebeat supports various input modules for common log formats and protocols, making it easy to integrate with existing infrastructure and streamline the data collection process. |
For demonstration purposes, we’ve arranged the following test machines to aid us in illustrating the installation and configuration procedures associated with setting up an ELK stack. Keep in mind that resource allocation to machines in your environment will vary and depend on the size of your infrastructure, as well as resource capacity.
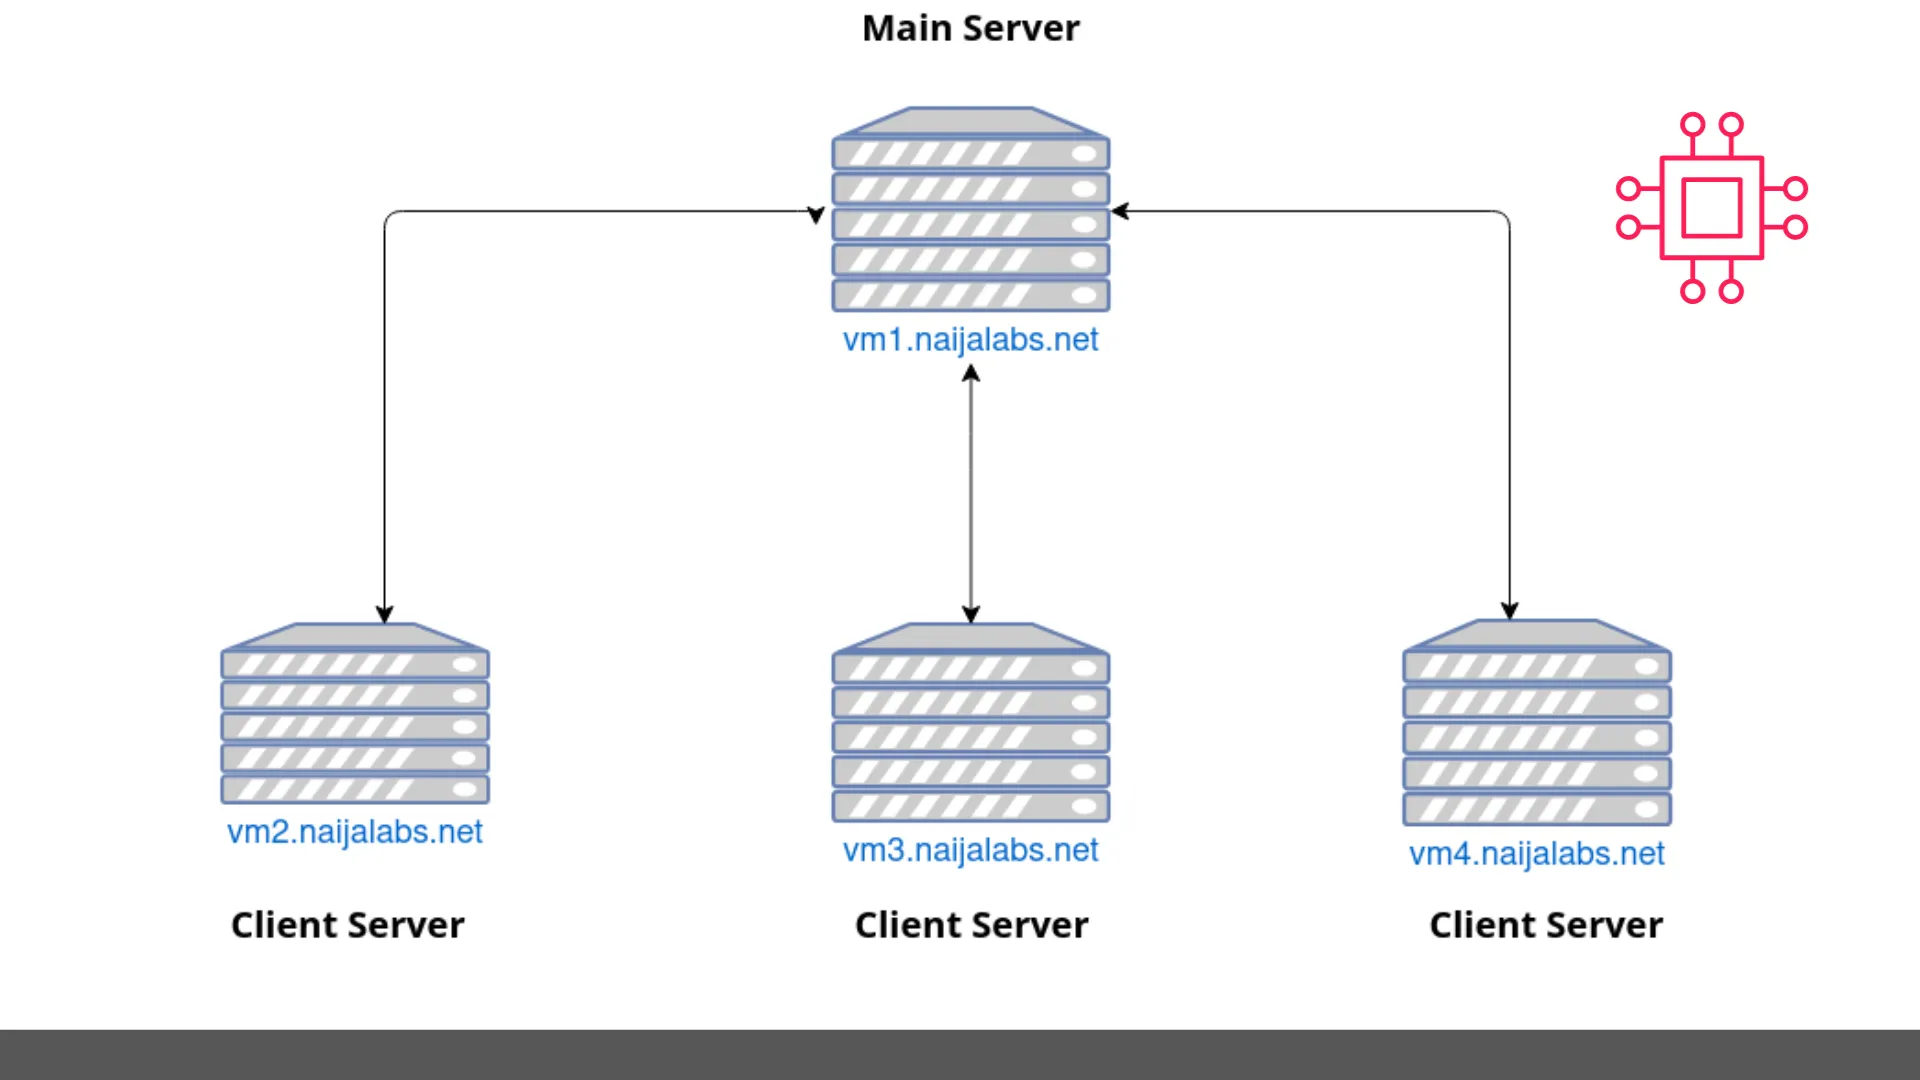
Photo by admingeek from Visual Paradigm Online
| Hostname | RAM (GB) | Cores | IP Address | Operating System (OS) | Designation |
| vm1.naijalabs.net | 6 | 2 | 192.168.1.19 | Red Hat Enterprise Linux release 9.3 (Plow) | Main Server |
| vm2.naijalabs.net | 4 | 2 | 192.168.1.21 | Fedora release 38 (Thirty Eight) | Client Server |
| vm3.naijalabs.net | 4 | 2 | 192.168.1.11 | Ubuntu 23.10 (Mantic Minotaur) | Client Server |
| vm4.naijalabs.net | 4 | 2 | 192.168.1.15 | Debian GNU/Linux 9 (stretch) | Client Server |
💡NOTE: Ensure that your |
By leveraging the combined capabilities of Elasticsearch, Logstash, Kibana, and Filebeat, organizations can build a robust and scalable data management and analysis platform capable of handling diverse data sources, performing complex analytics, and delivering actionable insights to drive business success. Let’s now delve into the installation process of the ELK stack:
First and foremost, it’s best practice to ensure your machines are up-to-date. Run the following command on all servers:
sudo dnf update # Linux Flavor (e.g Red Hat, CentOS, Fedora)
sudo apt update ; sudo apt ugprade # Debian Flavor (e.g Ubuntu/Debian)
Next, ensure that Java is installed on your system. ELK stack requires Java to run. You can install Java on RHEL 9 | CentOS 9 using the following command (on the main server):
sudo dnf install java-11-openjdk-devel
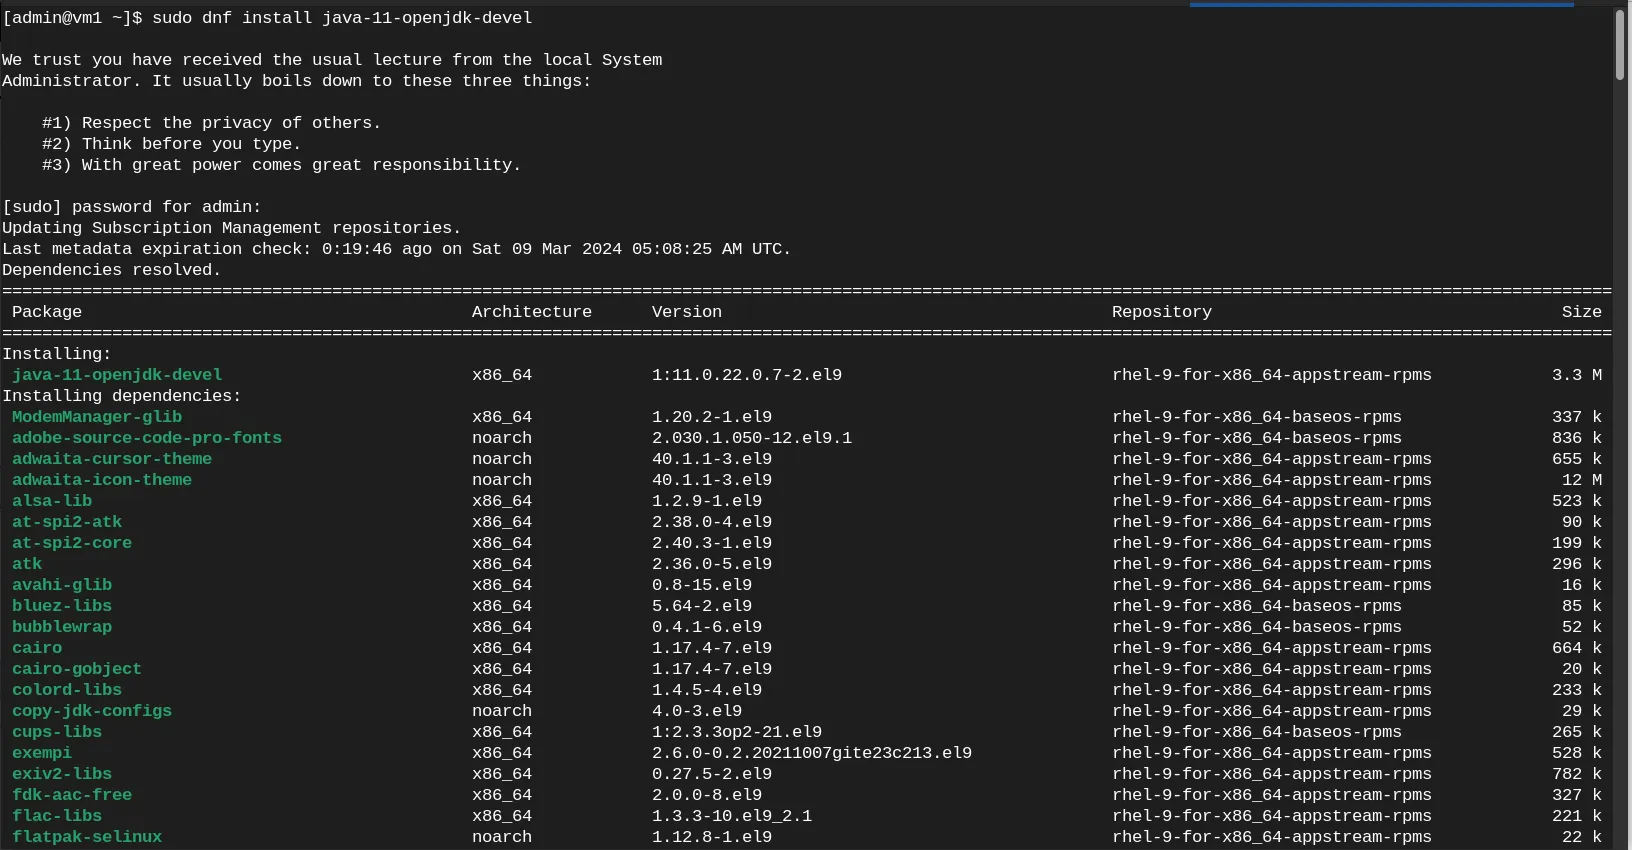
Photo by admingeek from Infotechys
Verify the version of Java you have installed:
java -version
					openjdk version "11.0.22" 2024-01-16 LTS
OpenJDK Runtime Environment (Red_Hat-11.0.22.0.7-1) (build 11.0.22+7-LTS)
OpenJDK 64-Bit Server VM (Red_Hat-11.0.22.0.7-1) (build 11.0.22+7-LTS, mixed mode, sharing)
Elasticsearch is a distributed, RESTful search engine that stores and indexes data. To install Elasticsearch on RHEL 9 | CentOS 9, follow these steps:
sudo rpm --import https://artifacts.elastic.co/GPG-KEY-elasticsearch
The command above imports the GPG key for elasticsearch. Using your preferred text editor, create an elasticsearch.repo file under /etc/yum.repos.d/ directory.
sudo vim /etc/yum.repos.d/elasticsearch.repo
Copy and paste the following content to it:
					[elasticsearch]
name=Elasticsearch repository for 8.x packages
baseurl=https://artifacts.elastic.co/packages/8.x/yum
gpgcheck=1
gpgkey=https://artifacts.elastic.co/GPG-KEY-elasticsearch
enabled=1
autorefresh=1
type=rpm-md
Save and exit the file. Then, run the following command to install elasticsearch:
sudo dnf install --enablerepo=elasticsearch elasticsearch
👀 Take note of the Security autoconfiguration information and specifically–your generated password as you will need it later: **Save this information in a text file somewhere on your machine** |
					--------------------------- Security autoconfiguration information ------------------------------

Authentication and authorization are enabled.
TLS for the transport and HTTP layers is enabled and configured.

The generated password for the elastic built-in superuser is : AFc*jflYr3OW1xYATgCP

If this node should join an existing cluster, you can reconfigure this with
'/usr/share/elasticsearch/bin/elasticsearch-reconfigure-node --enrollment-token <token-here>'
after creating an enrollment token on your existing cluster.

You can complete the following actions at any time:

Reset the password of the elastic built-in superuser with
'/usr/share/elasticsearch/bin/elasticsearch-reset-password -u elastic'.

Generate an enrollment token for Kibana instances with
 '/usr/share/elasticsearch/bin/elasticsearch-create-enrollment-token -s kibana'.

Generate an enrollment token for Elasticsearch nodes with
'/usr/share/elasticsearch/bin/elasticsearch-create-enrollment-token -s node'.

-------------------------------------------------------------------------------------------------
Using your preferred text editor, open the Elasticsearch configuration file located at: /etc/elasticsearch/elasticsearch.yml.
sudo vim /etc/elasticsearch/elasticsearch.yml
Remove the comment from the “cluster.name” and update it to your chosen cluster name. In our case, we’re naming our cluster “es-cluster“.
					# Use a descriptive name for your cluster:
#
cluster.name: es-cluster
Uncomment the “node.name” and update it to the hostname (preferably, the fully-qualified domain name (FQDN)) of your Elasticsearch server.
					# Use a descriptive name for the node:
#
node.name: vm1.naijalabs.net
Uncomment the “network.host” and update it to the FQDN of your Elasticsearch (main) server.
					# By default Elasticsearch is only accessible on localhost. Set a different
# address here to expose this node on the network:
#
network.host: vm1.naijalabs.net
**If you lack a FQDN or if your machine isn’t integrated into a DNS system, utilize your system’s IP address instead**
					# By default Elasticsearch is only accessible on localhost. Set a different
# address here to expose this node on the network:
#
network.host: 192.168.1.19
Lastly, remove the comment from “http.port” allowing Elasticsearch to specifically listen on port 9200.
					# By default Elasticsearch listens for HTTP traffic on the first free port it
# finds starting at 9200. Set a specific HTTP port here:
#
http.port: 9200
Save and exit the file. Then, run the following command to inform systemd of the Elasticsearch configuration information:
sudo systemctl daemon-reload
Start elasticsearch and enable it to autostart on boot.
sudo systemctl enable --now elasticsearch
Open port 9200 on your firewall to allow TCP traffic to your main server.
sudo firewall-cmd --permanent --add-port=9200/tcp; sudo firewall-cmd --reload
Become the root user and store the Elasticsearch built-in password as an environment variable named ELASTIC_PASSWORD using the export command.
export ELASTIC_PASSWORD="AFc*jflYr3OW1xYATgCP"
As the root user, execute the following command to verify functionality and ensure that Elasticsearch responds to basic HTTP requests.:
curl --cacert /etc/elasticsearch/certs/http_ca.crt -u elastic:$ELASTIC_PASSWORD https://localhost:9200
					{
  "name" : "vm1.naijalabs.net",
  "cluster_name" : "es-cluster",
  "cluster_uuid" : "QxRjxNL4QnK6qoCV0LXQdA",
  "version" : {
    "number" : "8.12.2",
    "build_flavor" : "default",
    "build_type" : "rpm",
    "build_hash" : "48a287ab9497e852de30327444b0809e55d46466",
    "build_date" : "2024-02-19T10:04:32.774273190Z",
    "build_snapshot" : false,
    "lucene_version" : "9.9.2",
    "minimum_wire_compatibility_version" : "7.17.0",
    "minimum_index_compatibility_version" : "7.0.0"
  },
  "tagline" : "You Know, for Search"
}
You should observe a similar output to what’s displayed above in your terminal. Ensure you’ve completed the preceding steps before proceeding with Kibana. As both Kibana and Logstash share the same Elasticsearch GPG key, there’s no requirement to re-import it before installing the packages.
Run the following command to install kibana:
sudo dnf install kibana
Run the following command to generate an enrollment token for Kibana:
sudo /usr/share/elasticsearch/bin/elasticsearch-create-enrollment-token -s kibana
eyJ2ZXIiOiI4LjEyLjIiLCJhZHIiOlsiMTkyLjE2OC4xLjE5OjkyMDAiXSwiZmdyIjoiZjEyZDQyNDRmMDZiYjk3YzdmY2JjOTQ4OThmMmIzNGM4ZDM0ZTViMjliYzVhNzViOTE1N2M5ZjVkNWYyZDFkMCIsImtleSI6InI5YTBNSTRCNFJ4SVFtNy1FZDVKOnB2bGtSeDV1US02WTNvMWZmbUFuTEEifQ==
Next, initiate the kibana setup with the following command:
					$ sudo /usr/share/kibana/bin/kibana-setup
? Enter enrollment token:
You’ll be prompted to provide the enrollment token generated in the previous step.
					? Enter enrollment token: eyJ2ZXIiOiI4LjEyLjIiLCJhZHIiOlsiMTkyLjE2OC4xLjE5OjkyMDAiXSwiZmdyIjoiZjEyZDQyNDRmMDZiYjk3YzdmY2JjOTQ4OThmMmIzNGM4ZDM0ZTViMjliYzVhNzViOTE1N2M5
ZjVkNWYyZDFkMCIsImtleSI6InI5YTBNSTRCNFJ4SVFtNy1FZDVKOnB2bGtSeDV1US02WTNvMWZmbUFuTEEifQ==
Copy and paste in the token and hit the [Enter] key to continue.
					✔ Kibana configured successfully.

To start Kibana run:
  bin/kibana
Run the following commands to start Kibana and enable it to autostart on boot:
sudo systemctl daemon-reload; systemctl enable --now kibana
Ensure that you can access the Kibana User Interface (UI) from another computer by allowing traffic on TCP port 5601.
sudo firewall-cmd --permanent --add-port=5601/tcp; sudo firewall-cmd --reload
For security reasons, it’s not ideal to run Kibana over HTTP. Using HTTPS is a safer option. Making sure your HTTPS session has a valid SSL certificate signed by an official (e.g. Letsencrypt, Digicert, GlobalSign, etc…) Certificate Authority (CA)–even better. We can set this up by using nginx as a proxy and directing it to http://localhost:5601. Don’t worry, we’ll show you how to do this in the next section.
Before anything else, confirm that your machine has the SSL certificate and key files (copied into place). In our setup, we’re using Letsencrypt, which has a designated location (/etc/letsencrypt/live/naijalabs.net) on our server:
					root@vm1.naijalabs.net: /etc
# ls -lh /etc/letsencrypt/live/naijalabs.net/
					total 4.0K
lrwxrwxrwx. 1 root root  37 Mar  2 23:37 cert.pem -> ../../archive/naijalabs.net/cert1.pem
lrwxrwxrwx. 1 root root  38 Mar  2 23:37 chain.pem -> ../../archive/naijalabs.net/chain1.pem
lrwxrwxrwx. 1 root root  42 Mar  2 23:37 fullchain.pem -> ../../archive/naijalabs.net/fullchain1.pem
lrwxrwxrwx. 1 root root  40 Mar  2 23:37 privkey.pem -> ../../archive/naijalabs.net/privkey1.pem
-rw-r--r--. 1 root root 692 Mar  2 23:37 README
Next, run the following command to install Nginx:
sudo dnf install nginx
Create a kibana.conf file to setup nginx as proxy for the Kibana UI:
sudo vim /etc/nginx/conf.d/kibana.conf
Copy and paste the following content into it:
					server {
        listen      80;
        listen      [::]:80;
        listen      443 ssl http2;
        listen      [::]:443 ssl http2;
        server_name vm1.naijalabs.net;

        ssl_certificate "/etc/letsencrypt/live/naijalabs.net/fullchain.pem";
        ssl_certificate_key "/etc/letsencrypt/live/naijalabs.net/privkey.pem";
        ssl_session_cache shared:SSL:1m;
        ssl_session_timeout  10m;

        proxy_redirect      off;
        proxy_set_header    X-Real-IP $remote_addr;
        proxy_set_header    X-Forwarded-For $proxy_add_x_forwarded_for;
        proxy_set_header    Host $http_host;

        location / {
                proxy_pass http://localhost:5601;
        }
}
Ensure the paths to ssl_certificate and ssl_certificate_key point to where your SSL certificate and key files reside on your machine.
Run the following commands to start Nginx and enable it to autostart on boot:
sudo systemctl daemon-reload; sudo systemctl enable --now nginx
Allow TCP traffic over ports 80 and 443 with the following command:
sudo firewall-cmd --permanent --add-port=80/tcp --add-port=443/tcp ; sudo firewall-cmd --reload
To enable network connections between Nginx and the Kibana UI, execute the following commands to adjust the SELinux Boolean accordingly.
sudo setsebool -P httpd_can_network_connect 1; sudo setsebool -P nis_enabled 1
Congratulations! Our Kibana Instance is now secure and accessible over HTTPS!
Launch the Kibana UI by entering the following URL: https://<elasticsearch-server or main-server-FQDN> or, in our case https://vm1.naijalabs.net
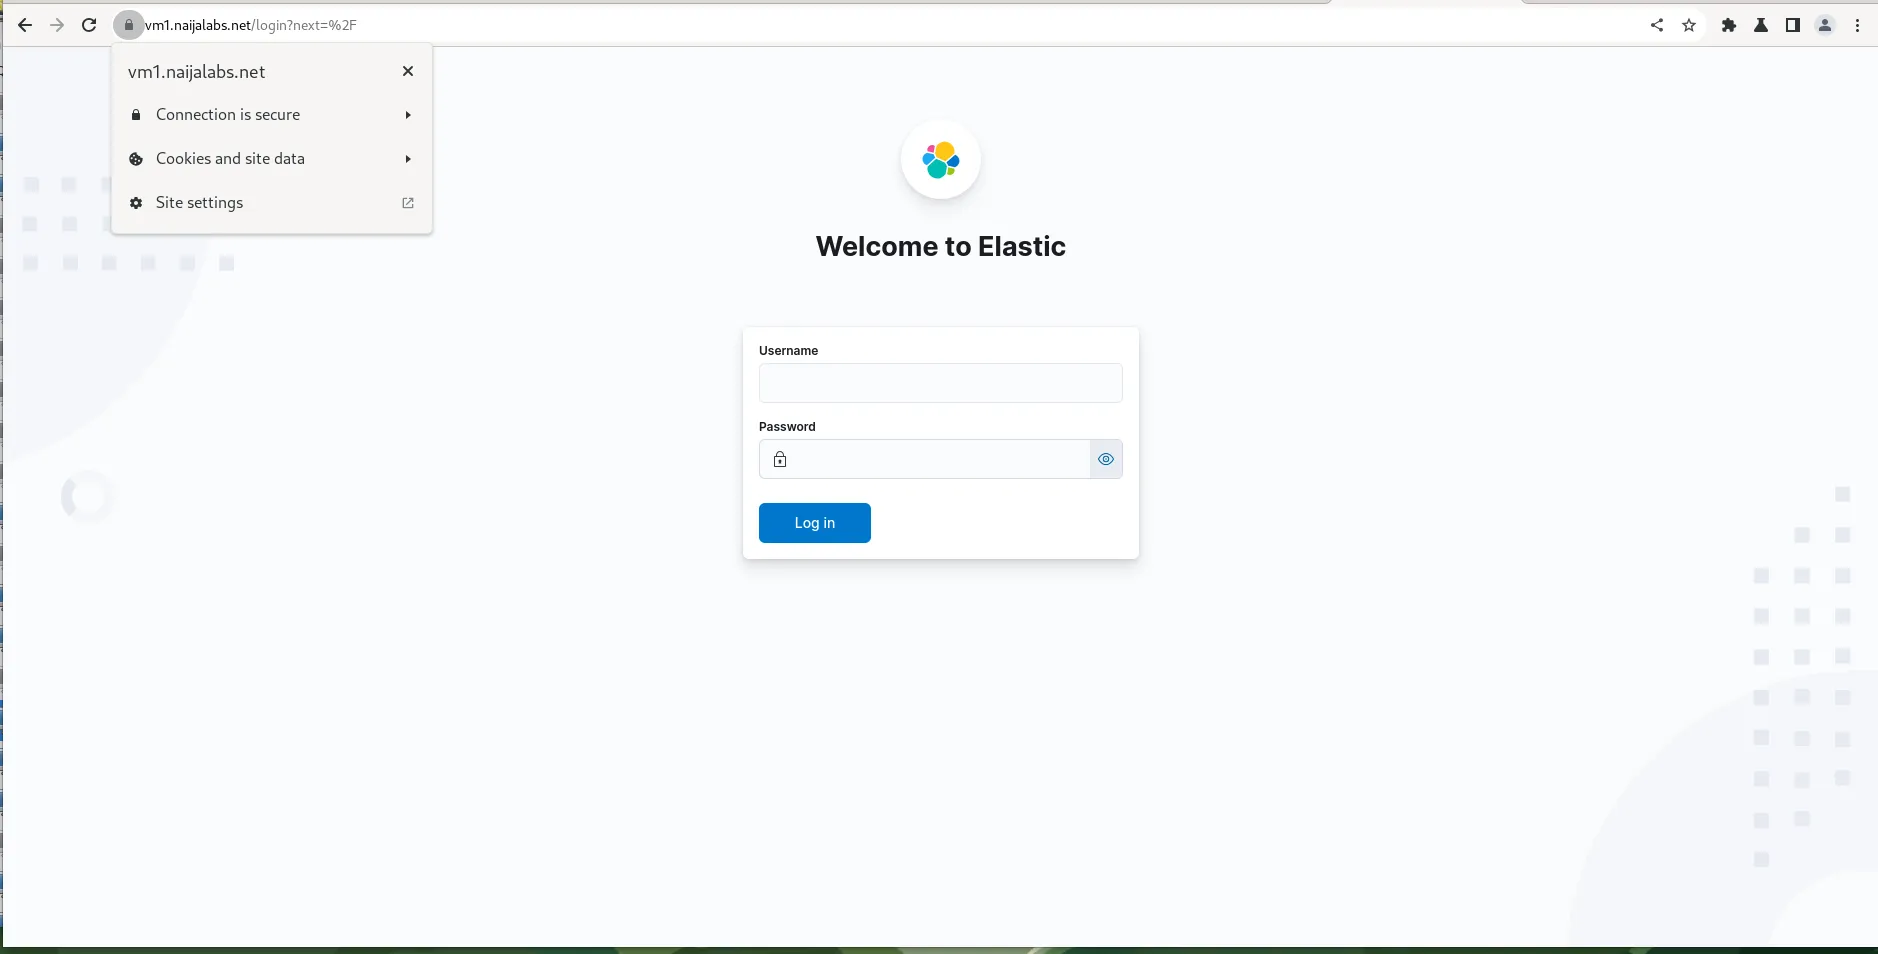
Photo by admingeek from Infotechys
Enter your login credentials which was provided earlier in the Security Autoconfiguration Information Section. In our case the username is the same: elastic. The password (ELASTIC_PASSWORD) will differ as it is randomly generated each time Elasticsearch is installed.
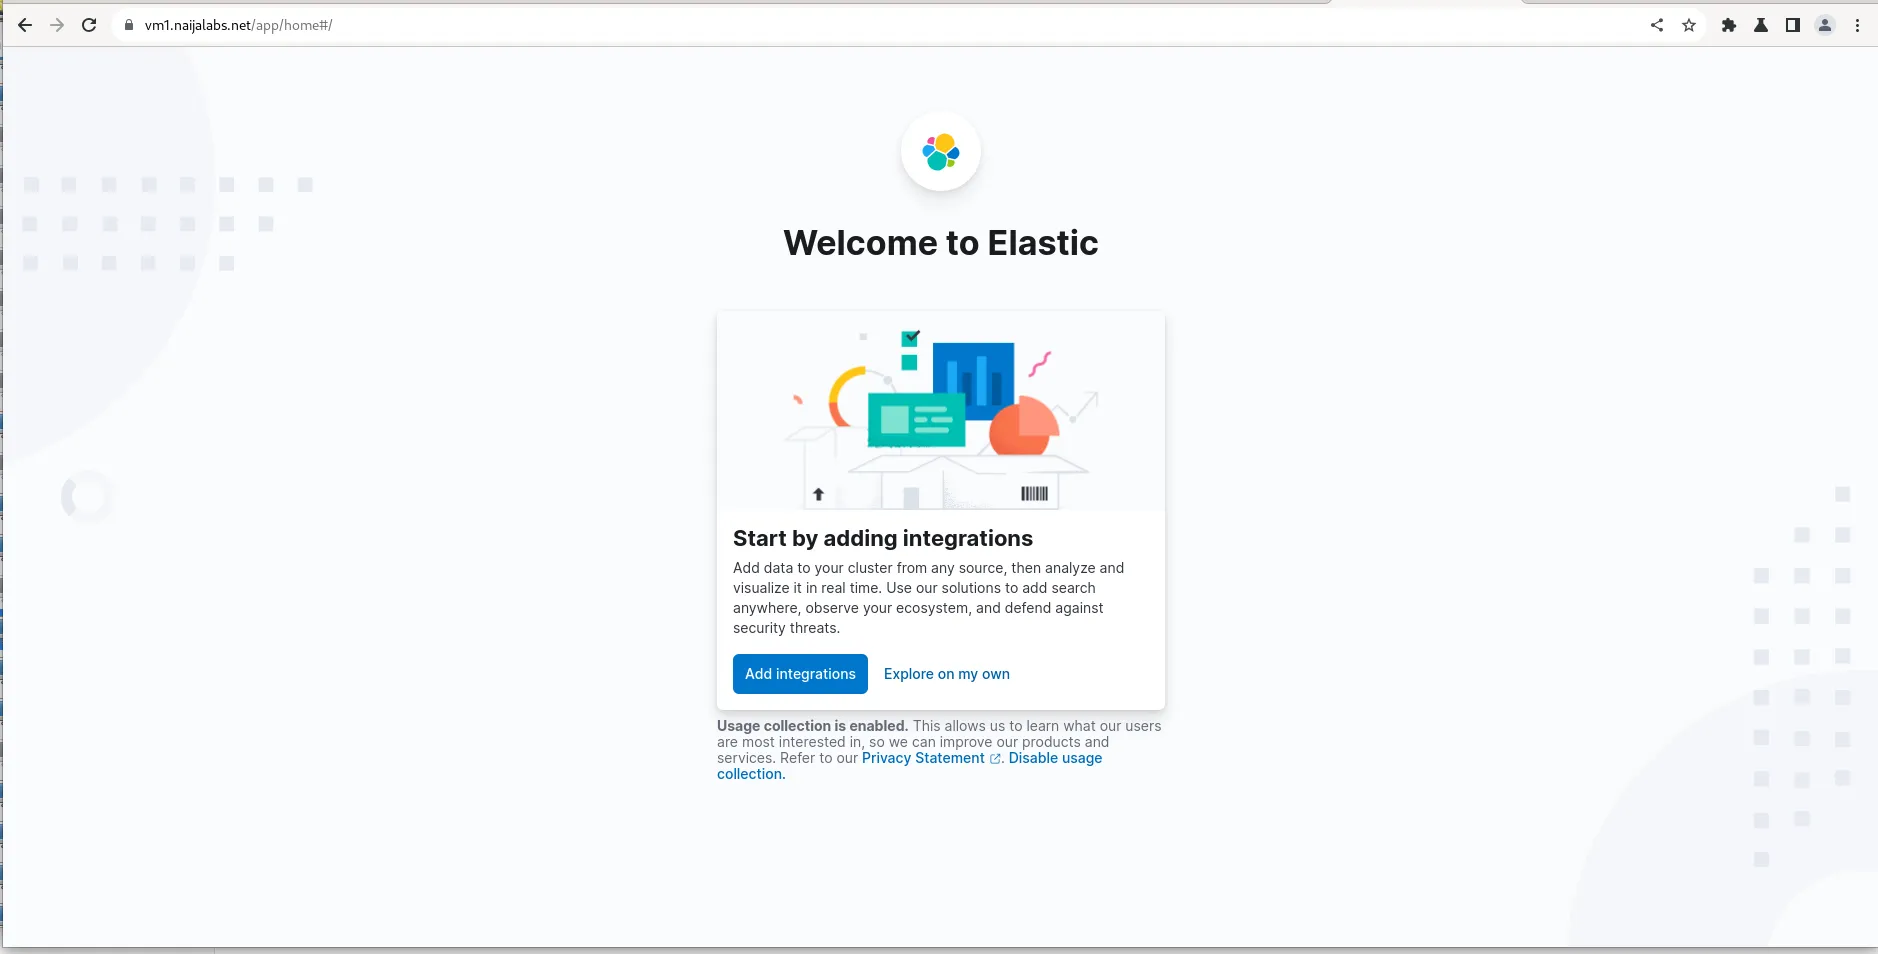
Photo by admingeek from Infotechys
Click the “Explore on my own” link to be greeted with the Home Page.
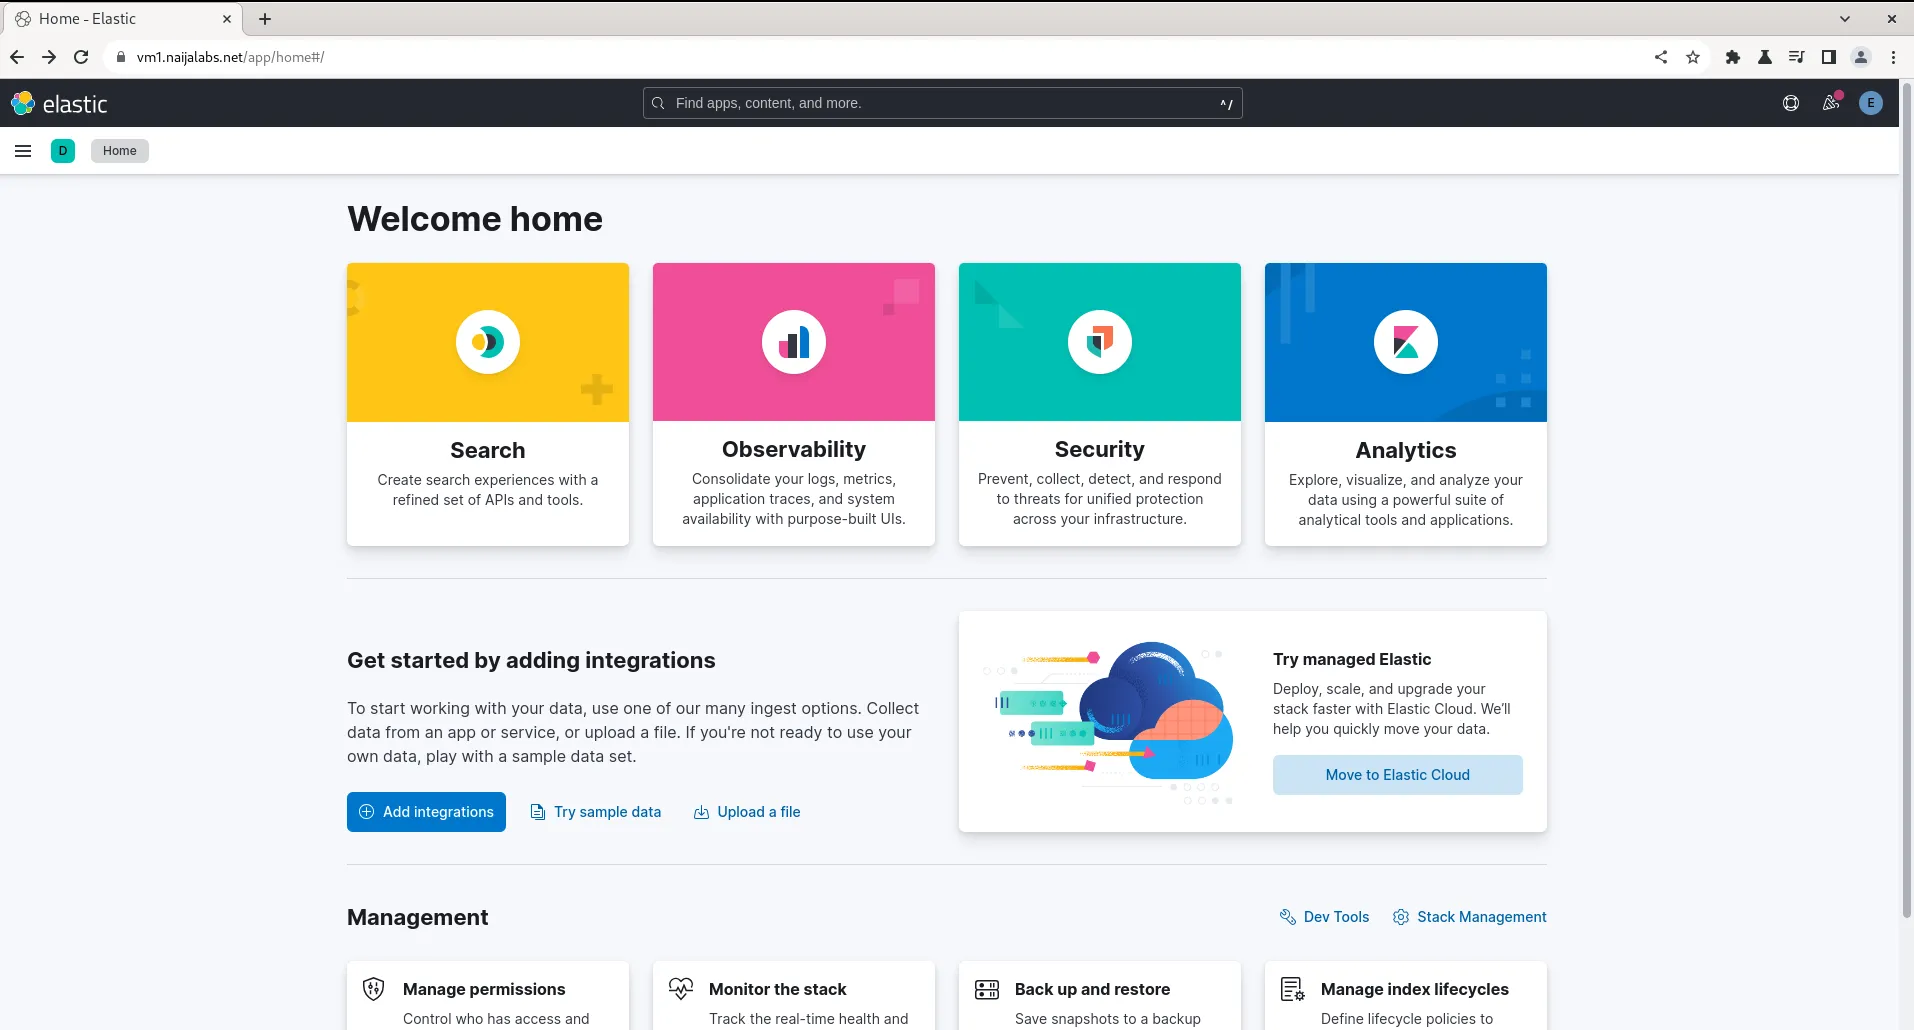
Photo by admingeek from Infotechys
With successful login, we’ve now established an operational Elasticsearch server running alongside Kibana. Now, let’s move forward with setting up Logstash.
For this part of the ELK installation, we’ll install Logstash on our Fedora 38 client instance. However, this procedure will work on any rpm-based distribution (e.g. Redhat 8+, CentOS 8+). Let’s begin by installing Java-11:
sudo dnf install java-11-openjdk-devel
As this is another machine, we’ll need to import the GPG key for Elasticsearch.
sudo rpm --import https://artifacts.elastic.co/GPG-KEY-elasticsearch
Copy and paste the following contents into the /etc/yum.repos.d/logstash.repo file.
					[elastic-8.x]
name=Elastic repository for 8.x packages
baseurl=https://artifacts.elastic.co/packages/8.x/yum
gpgcheck=1
gpgkey=https://artifacts.elastic.co/GPG-KEY-elasticsearch
enabled=1
autorefresh=1
type=rpm-md
Save and quit the file. We can now proceed with the logstash install:
sudo dnf install logstash
Regarding Debian-based distributions (e.g Ubuntu or Debian), the Logstash installation and configuration procedures are virtually the same with some differences in command-line syntax. Let’s begin with installing Java-11:
sudo apt install openjdk-11-jdk
Run the following commands to import the GPG key for Elasticsearch and establish the sources required to install Logstash.
wget -qO - https://artifacts.elastic.co/GPG-KEY-elasticsearch | sudo apt-key add -
sudo apt install apt-transport-https
echo "deb https://artifacts.elastic.co/packages/8.x/apt stable main" | sudo tee -a /etc/apt/sources.list.d/elastic-8.x.list
Install Logstash with the following command (s):
sudo apt upgrade -y; sudo apt install logstash
We’ll showcase Logstash functionality by focusing solely on reading the /var/log/messages file on the client instance (vm2.naijalabs.net) for simplicity. Utilizing the diverse array of plugins at our disposal, we’ll configure Logstash to filter and organize the log messages into a format suitable for ingestion by Elasticsearch. To commence, let’s create a configuration file named varlog.conf within the /etc/logstash/conf.d/ directory.
sudo vim /etc/logstash/conf.d/varlog.conf
For the input section, copy and paste the following (below) to the file (Then, save and exit the file):
					input {
  file {
    id => "messages_fedora_38"
    path => "/var/log/messages"
  }
}
filter {}

output {
  stdout {}

}
Input Configuration:
|
File Plugin:
|
You might wonder why the filter block is currently empty. Additionally, we’re using the stdout plugin in the output block to route all processed events to standard output or the console. This step is essential for observing and analyzing the generated output from the logs.
To trigger a log entry in the /var/log/messages file on our client server, follow these steps:
sudo adduser testuser; sudo userdel -r testuser
On the other terminal, run the following command:
sudo /usr/share/logstash/bin/logstash -f /etc/logstash/conf.d/varlog.conf -r
This command runs Logstash with superuser privileges, using our specific configuration file (varlog.conf), and enables automatic reloading of the configuration when changes are detected. Now, let’s examine the event logs generated when we created and deleted the testuser account.
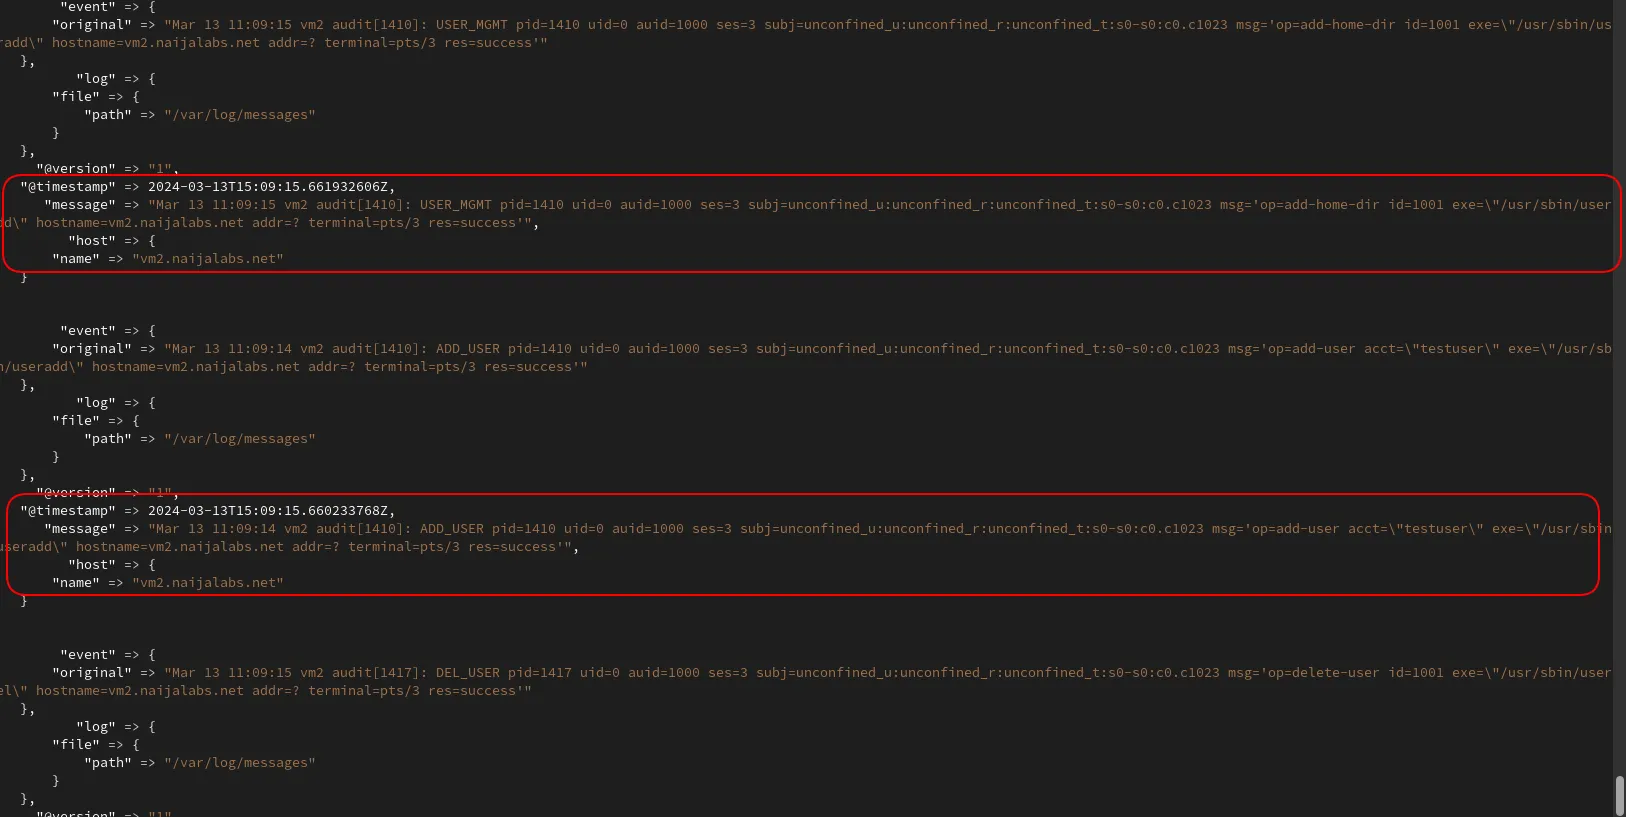
Photo by admingeek from Infotechys
Focus on the areas circled in red. Here, we observe log messages displaying an event that we initiated on our client machine. However, we must filter the message and organize it in a format that Elasticsearch can comprehend. This leads us to the next section.
Append the varlog.conf file with the following content:
					filter {
  grok {
    match => { "message" => "%{SYSLOGTIMESTAMP:timestamp} %{SYSLOGHOST:host} %{WORD:audit}\[%{NUMBER:pid}\]: %{WORD:action} %{GREEDYDATA:message}" }
    overwrite => [ "message" ]

  }
  mutate {
    remove_field => [ "original", "@version" ]
  }

  kv {
    field_split => " "
  }
  mutate {
    remove_field => [ "message", "event", "host" ]
  }
}
The table below provides a breakdown of each field, helping us gain a better understanding of the actions performed by the filter block.
Grok Filter |
|
Mutate Filter (First Entry) |
|
Key-Value (KV) Filter |
|
Mutate Filter (Second Entry) |
|
In summary, this Logstash filter configuration parses unstructured log data using the Grok filter, performs field manipulations with the Mutate filter, parses key-value pairs with the KV filter, and removes any remaining unnecessary fields with the second Mutate filter.
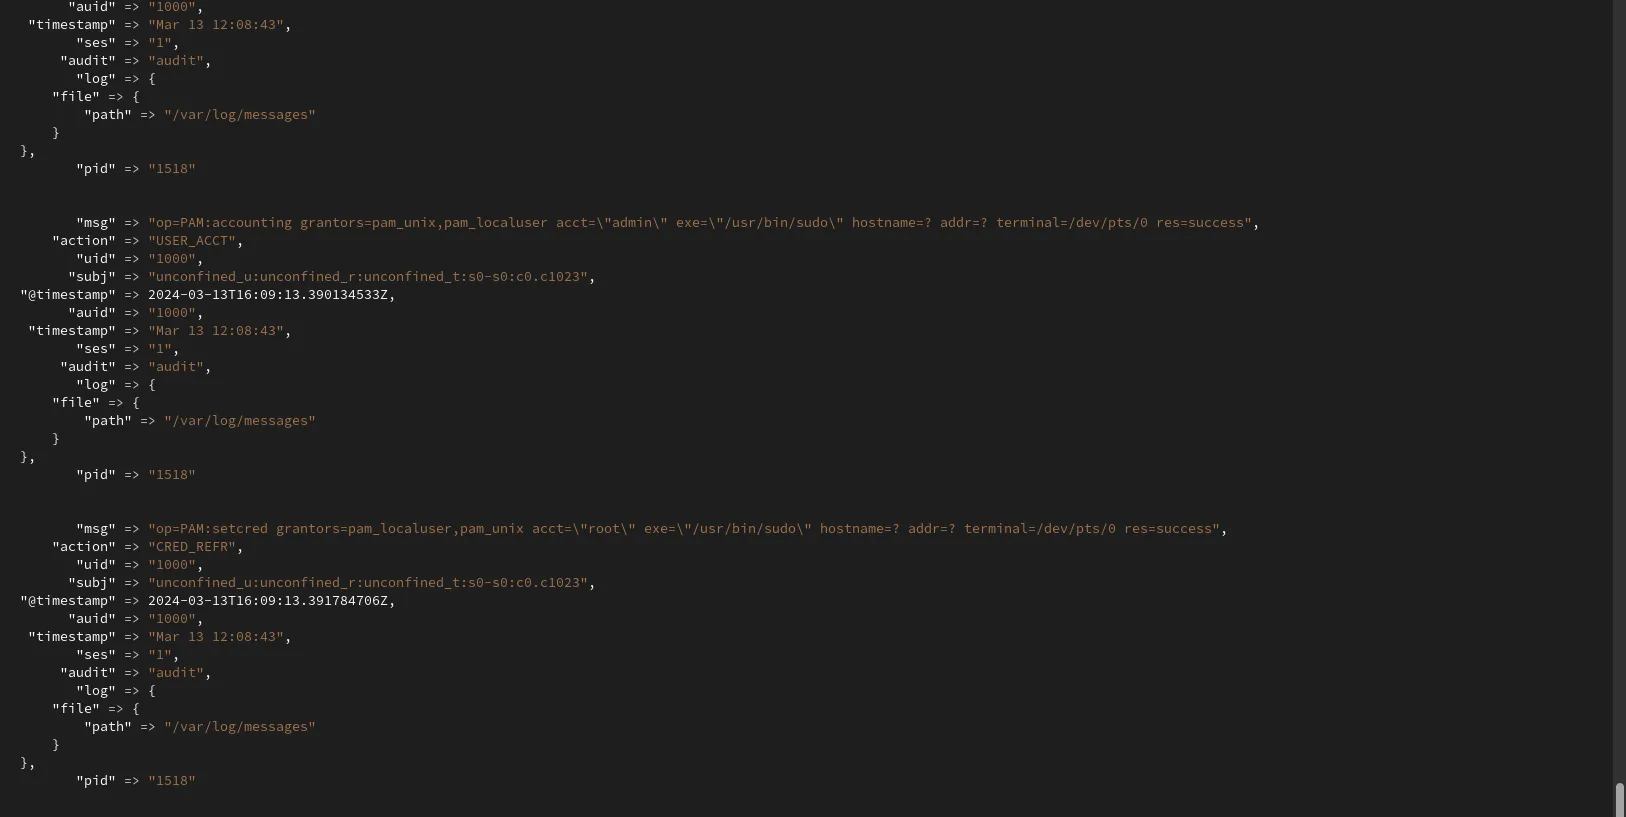
Photo by admingeek from Infotechys
Furthermore, observe how the log data is organized and structured, thanks to the filter entries–presenting the logs in a format that Elasticsearch understands. This brings us to our next section, where we will construct our output block.
Append the following to the output block (then, save and exit the file):
output {
stdout {}
elasticsearch {
hosts => ["https://192.168.1.19"]
index => "messages-%{+YYYY.MM.dd}"
user => "elastic"
password => "AFc*jflYr3OW1xYATgCP"
ssl => true
cacert => "/etc/logstash/http_ca.crt"
}
}
Let’s break down the Logstash output configuration:
|
|
In summary, this Logstash output configuration sends events to both standard output (for debugging or monitoring purposes) and Elasticsearch for indexing and storage, using HTTPS with SSL/TLS encryption and authentication. If you’ve been attentively following this tutorial, your varlog.conf file should closely resemble the output displayed below, with some variations in fields like hosts, id, and password:
input {
file {
id => "messages_fedora_38"
path => "/var/log/messages"
}
}
filter {
grok {
match => { "message" => "%{SYSLOGTIMESTAMP:timestamp} %{SYSLOGHOST:host} %{WORD:audit}\[%{NUMBER:pid}\]: %{WORD:action} %{GREEDYDATA:message}" }
overwrite => [ "message"
				]
}
mutate {
remove_field => [ "original", "@version" ]
}
kv {
field_split => " "
}
mutate {
remove_field => [ "message", "event", "host" ]
}
}
					output {
  stdout {}
  elasticsearch {
    hosts => ["https://192.168.1.19"]
    index => "messages-%{+YYYY.MM.dd}"
    user => "elastic"
    password => "AFc*jflYr3OW1xYATgCP"
    ssl => true
    cacert => "/etc/logstash/http_ca.crt"
  }
}
The contents of your varlog.conf file should closely resemble the displayed configuration, with exceptions in the hosts and password fields.
You’ll notice errors in the log output because we need to copy the CA certificate (http_ca.crt) from our main Elasticsearch server (vm1.naijalabs.net) to our client instance (vm2.naijalabs.net). This enables Logstash to communicate with Elasticsearch over secure SSL/TLS encryption (HTTPS). Execute the following commands to navigate to the appropriate location and copy the CA certificate:
cd /etc/logstash; scp root@vm1:/etc/elasticsearch/certs/http_ca.crt .
Also, change the ownership permissions to the /etc/logstash/conf.d directory to ensure the Logstash user has access to the configuration file.
sudo chown -Rv :logstash /etc/logstash/conf.d/
Next, start and enable Logstash to autostart upon reboot.
sudo systemctl daemon-reload; sudo systemctl enable --now logstash
Reboot the client.
sudo systemctl reboot
Check the status and verify Logstash is still running after reboot.
sudo systemctl status logstash
					● logstash.service - logstash
     Loaded: loaded (/usr/lib/systemd/system/logstash.service; enabled; preset: disabled)
    Drop-In: /usr/lib/systemd/system/service.d
             └─10-timeout-abort.conf
     Active: active (running) since Wed 2024-03-13 13:51:04 EDT; 23s ago
   Main PID: 1331 (java)
      Tasks: 22 (limit: 4643)
     Memory: 453.3M
        CPU: 41.968s
     CGroup: /system.slice/logstash.service
             └─1331 /usr/share/logstash/jdk/bin/java -XX:+HeapDumpOnOutOfMemoryError -Dlogstash.jackson.stream-read-constraints.max-number-length=10000 --add-opens=java.base/java.nio.channels=ALL-UNNAME>

Mar 13 13:51:04 vm2.naijalabs.net systemd[1]: Started logstash.service - logstash.
Mar 13 13:51:04 vm2.naijalabs.net logstash[1331]: Using bundled JDK: /usr/share/logstash/jdk
Mar 13 13:51:22 vm2.naijalabs.net logstash[1331]: /usr/share/logstash/vendor/bundle/jruby/3.1.0/gems/concurrent-ruby-1.1.9/lib/concurrent-ruby/concurrent/executor/java_thread_pool_executor.rb:13: warnin>
Mar 13 13:51:22 vm2.naijalabs.net logstash[1331]: /usr/share/logstash/vendor/bundle/jruby/3.1.0/gems/concurrent-ruby-1.1.9/lib/concurrent-ruby/concurrent/executor/java_thread_pool_executor.rb:13: warnin>
Well done! We’ve successfully finished installing and configuring Logstash. In the next section, we’ll delve into the Kibana UI to confirm that the logs are being shipped as expected. Now challenge yourself and try installing and configuring Logstash on another client!
💡We’ve also successfully set up Logstash on our Debian instances server (vm3.naijalabs.net, vm4.naijalabs.net). However, to avoid redundancy, we didn’t include those procedures in this tutorial. |
Navigate to Stack Management -> Index Management from the (right-side) menu:
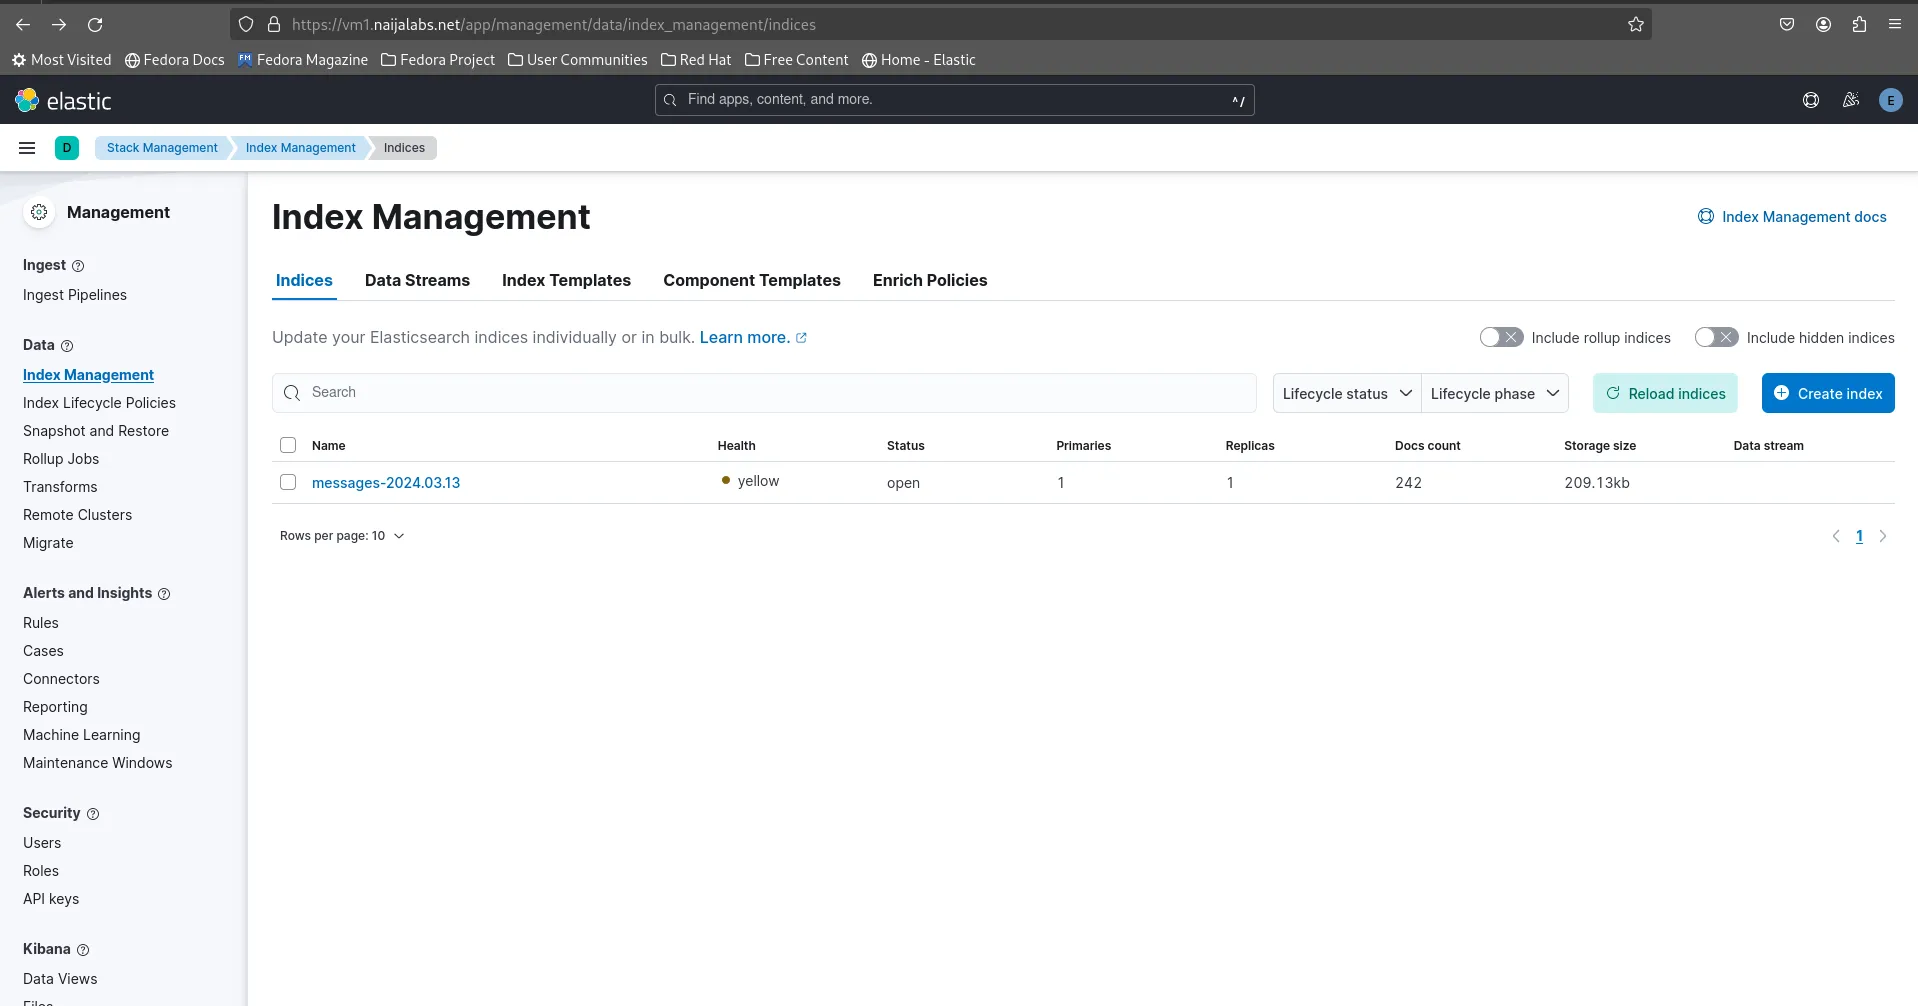
Photo by admingeek from Infotechys
You should see the index “messages” along with the timestamp. Click the [Reload Indices] button to update the index data count in real-time. Next, navigate to Kibana -> Data Views to create data views using the index data.
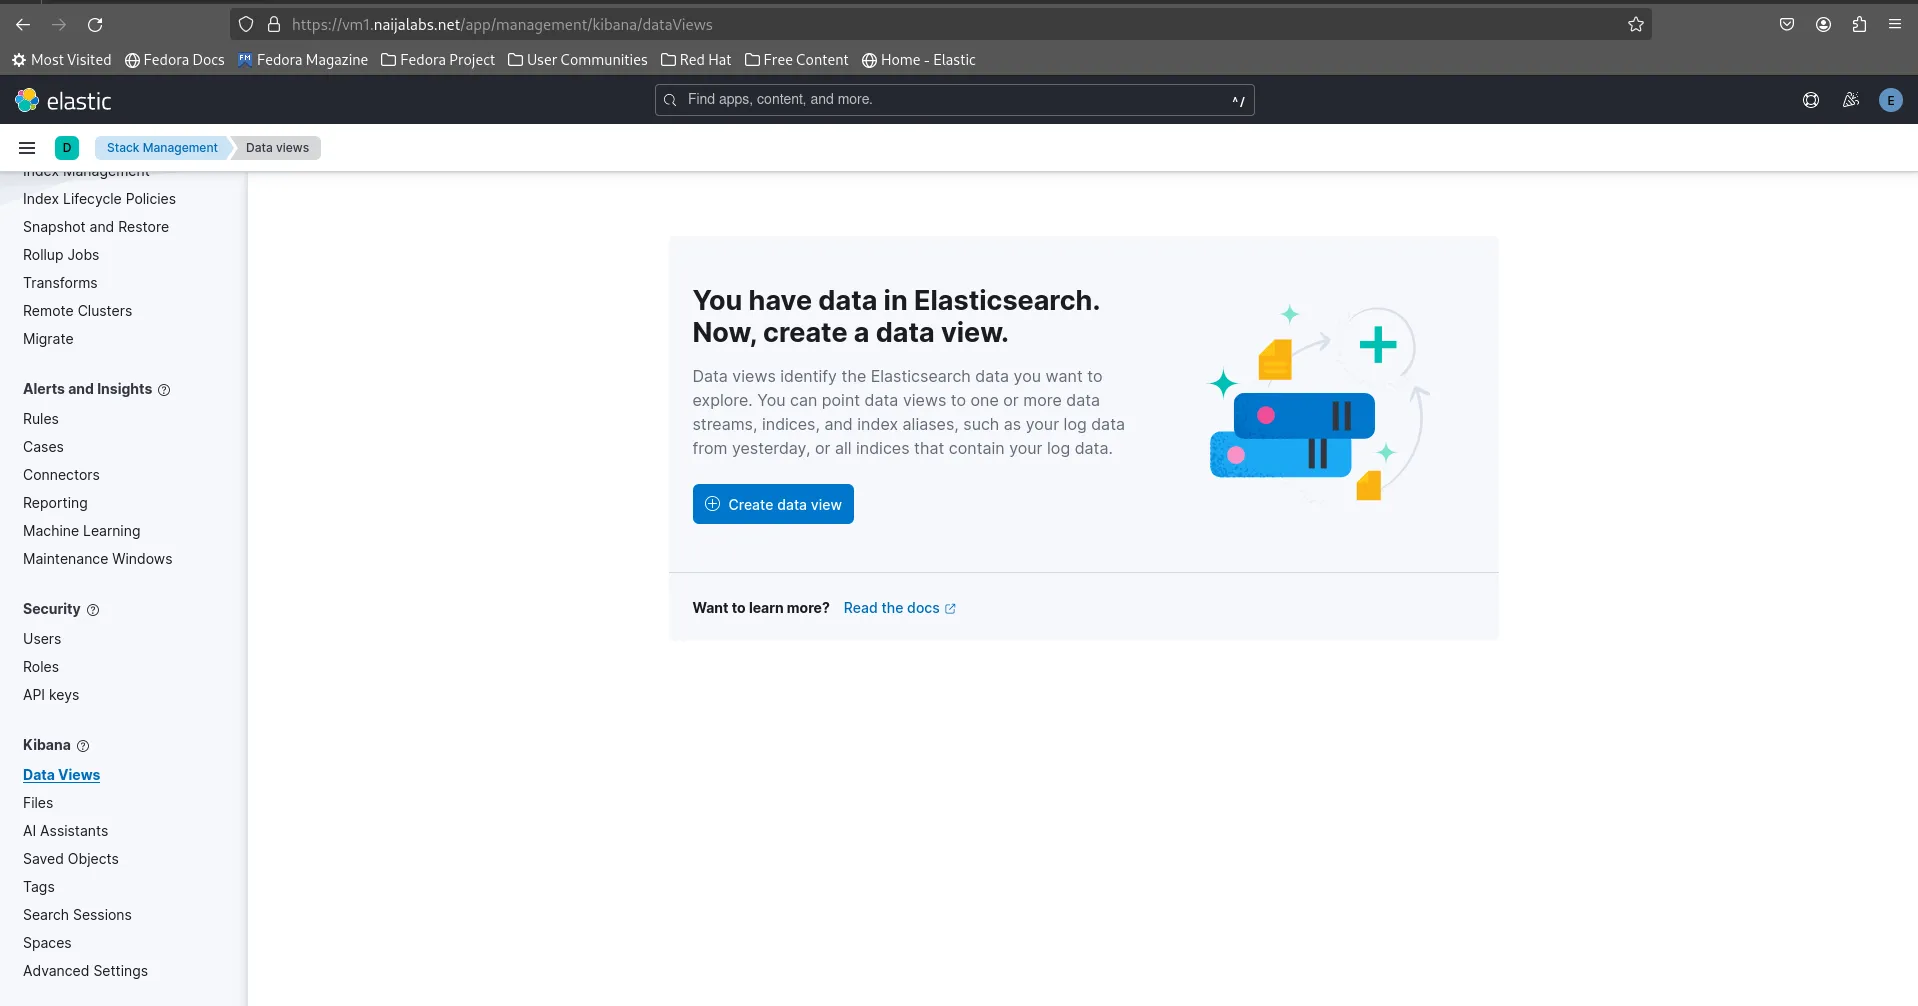
Photo by admingeek from Infotechys
Click the [Create Data View] button to proceed:
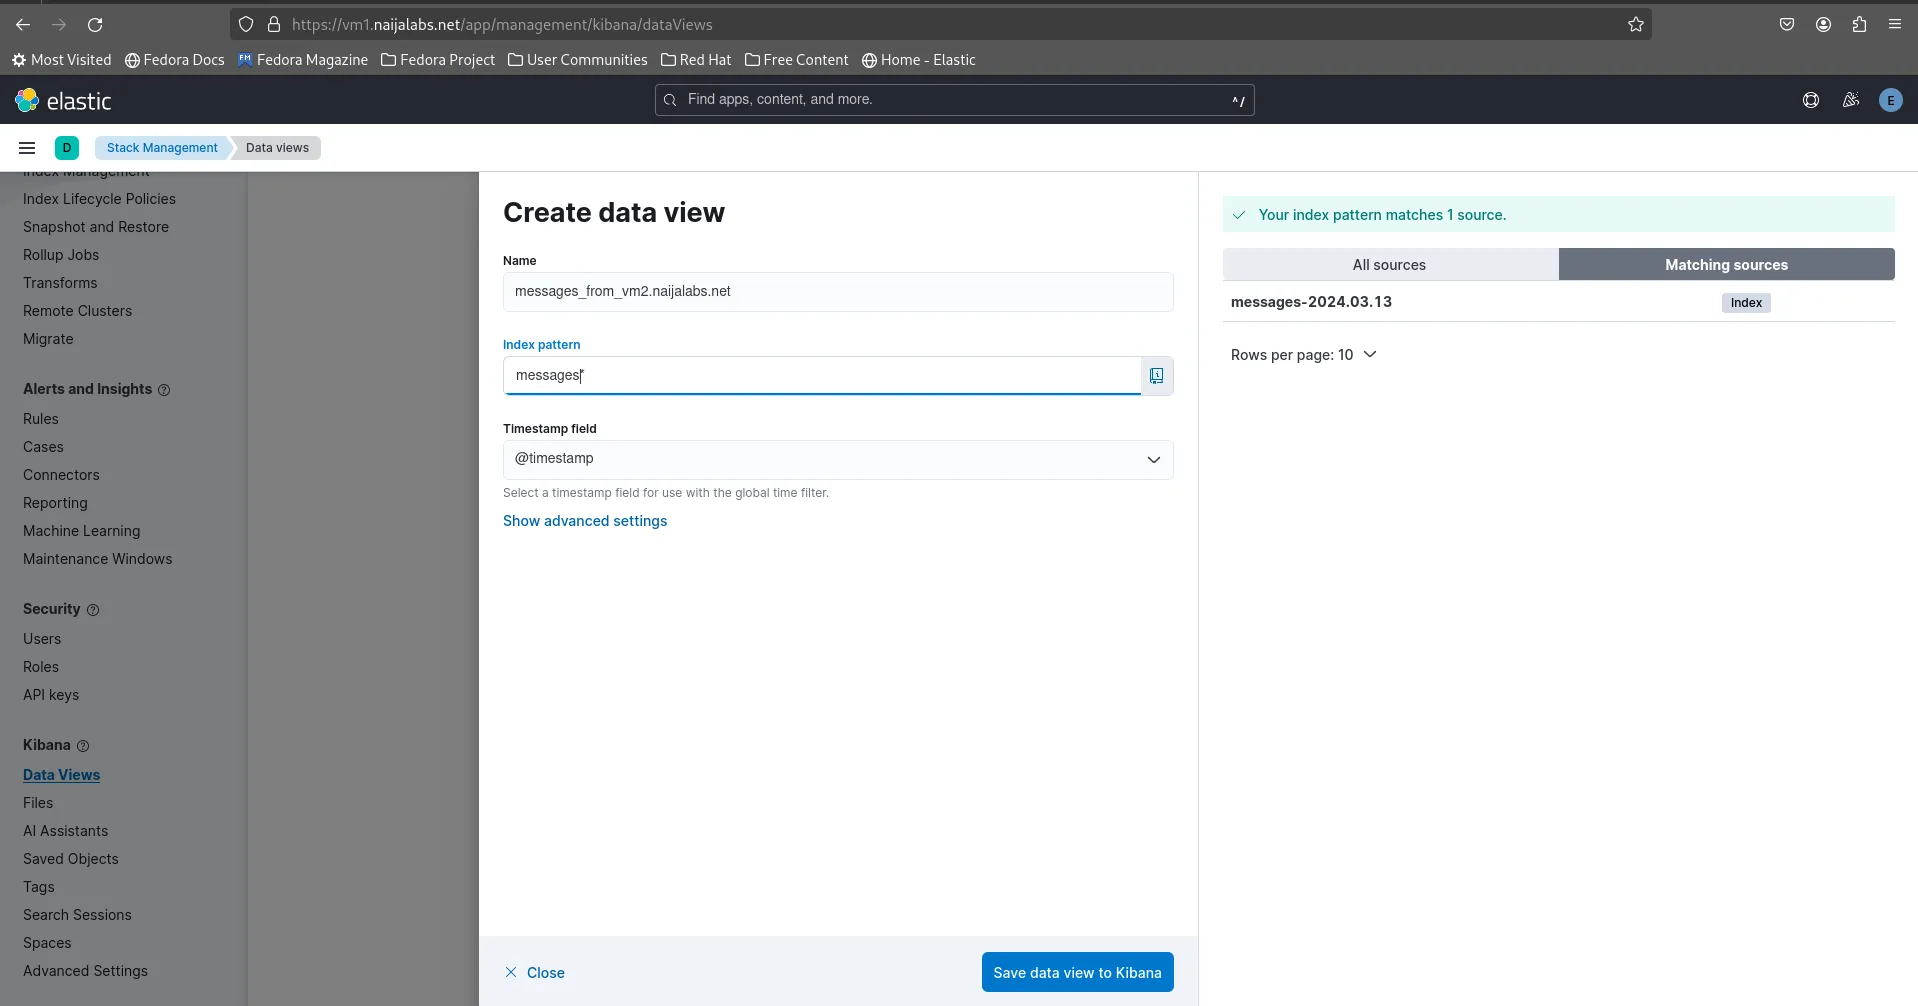
Photo by admingeek from Infotechys
You will now be prompted to name your new Data View (we chose: messages_from_vm2.naijalabs.net). In addition, enter the index name in the textbox labeled “Index Pattern“. Then, click the [Save data view to Kibana] button to proceed:
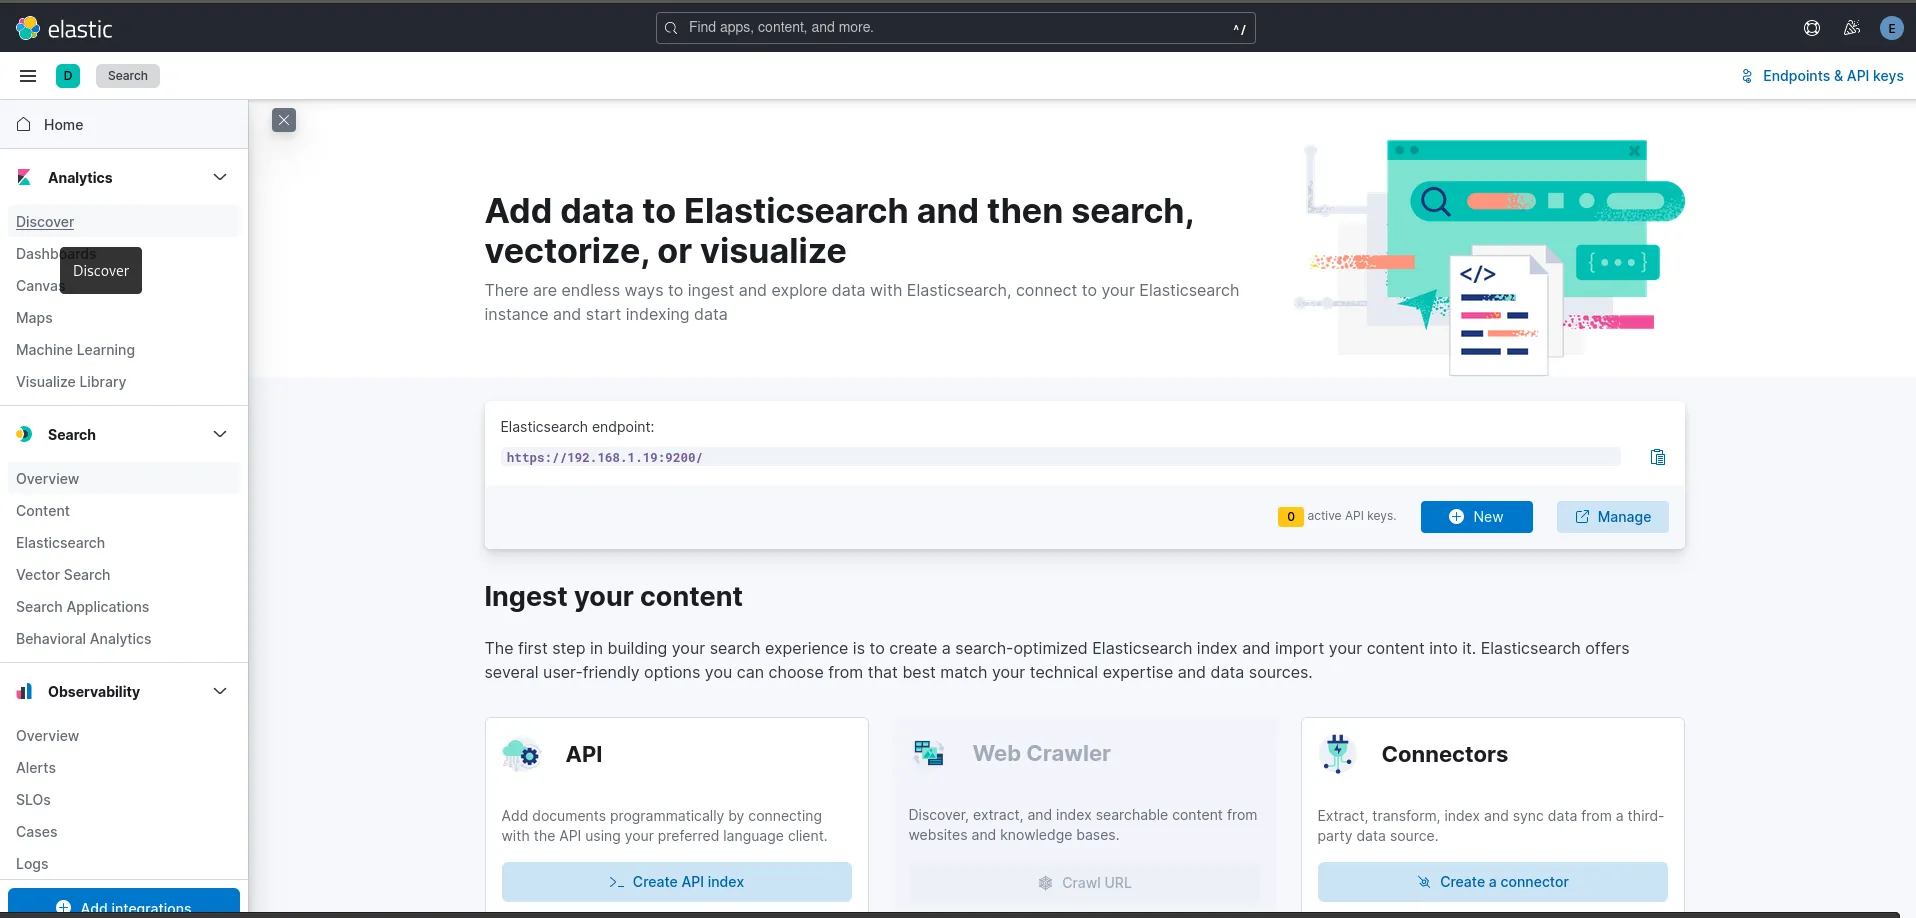
Photo by admingeek from Infotechys
Head over to Analytics -> Discover to access a graphical representation of the data. Discover offers a wide range of functionalities, so feel free to explore the documentation for additional tips and howtos.
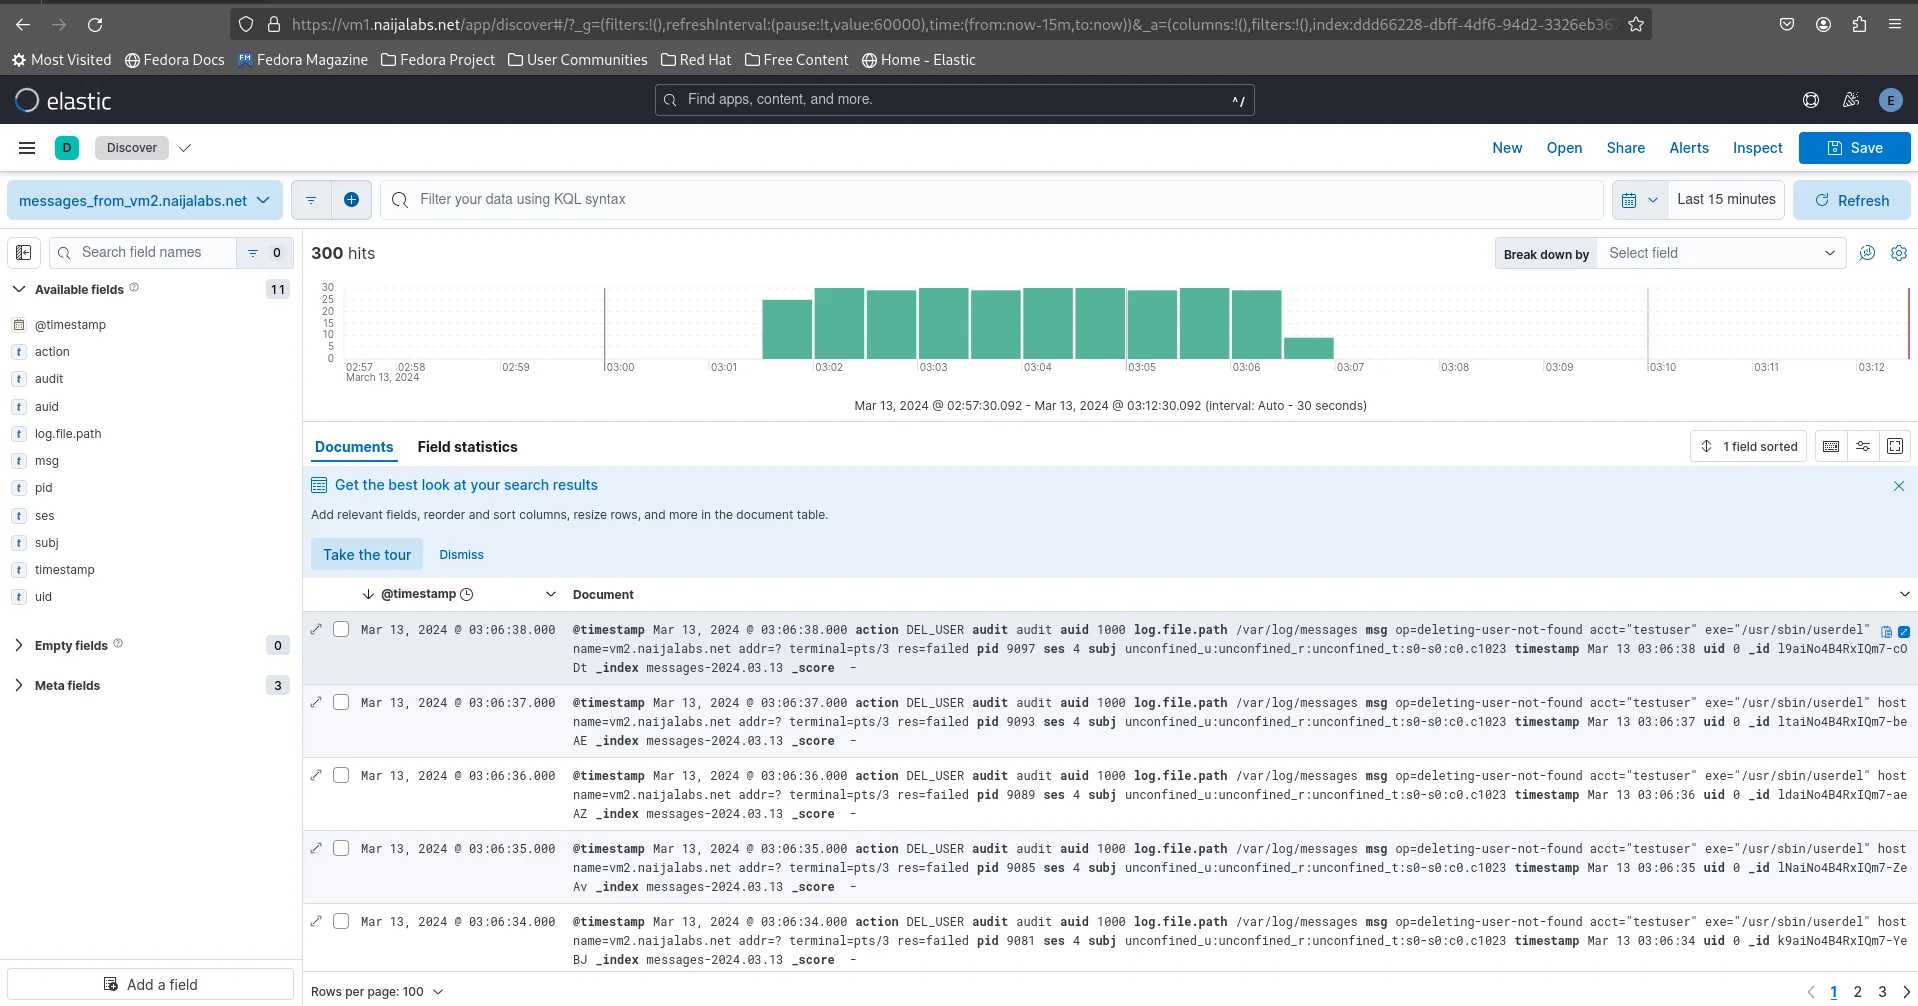
Photo by admingeek from Infotechys
Now that Elasticsearch, Kibana, and Logstash are all confirmed to be working as expected, we can move on to the final section and proceed with the installation and configuration of Filebeat.
For this demonstration, we’ll set up and configure Filebeat on our primary server (vm1.naijalabs.net) to monitor the Elasticsearch logs. Run the following command to install it:
sudo dnf install filebeat
NOTE before installing filebeat: If you’re installing Filebeat on a new server, you’ll need to import the Elasticsearch GPG key:
rpm --import https://artifacts.elastic.co/GPG-KEY-elasticsearch
As well as, copy and paste the following (below) into the /etc/yum.repos.d/filebeat.repo file.
					[elastic-8.x]
name=Elastic repository for 8.x packages
baseurl=https://artifacts.elastic.co/packages/8.x/yum
gpgcheck=1
gpgkey=https://artifacts.elastic.co/GPG-KEY-elasticsearch
enabled=1
autorefresh=1
type=rpm-md
Run the following command to obtain the fingerprint for the Elasticsearch CA (http_ca.crt) you’ll need it later:
sudo openssl x509 -fingerprint -sha256 -in /etc/elasticsearch/certs/http_ca.crt
					sha256 Fingerprint=F1:2D:42:44:F0:6B:B9:7C:7F:CB:C9:48:98:F2:B3:4C:8D:34:E5:B2:9B:C5:A7:5B:91:57:C9:F5:D5:F2:D1:D0
-----BEGIN CERTIFICATE-----
MIIFWTCCA0GgAwIBAgIUVaQ6k8WXfv9D71fL8PQvwko+V0owDQYJKoZIhvcNAQEL
BQAwPDE6MDgGA1UEAxMxRWxhc3RpY3NlYXJjaCBzZWN1cml0eSBhdXRvLWNvbmZp
Z3VyYXRpb24gSFRUUCBDQTAeFw0yNDAzMTIwMjI5MDhaFw0yNzAzMTIwMjI5MDha
MDwxOjA4BgNVBAMTMUVsYXN0aWNzZWFyY2ggc2VjdXJpdHkgYXV0by1jb25maWd1
cmF0aW9uIEhUVFAgQ0EwggIiMA0GCSqGSIb3DQEBAQUAA4ICDwAwggIKAoICAQCD
KCqOuvHZDxXoN7b7OLZfMfjXfL7NH0Iwr7f+Qu5V7SVW8/vU1xn+QC5U3dXo785n
BItJBBCVuuZpV8nW7LmrzVIj8dfn7b63cgIfRraJ3HpbWRO1Pk7lx48pn1YUlyTT
UieKGUQR4nifVqjSWtJQVXzYhTIHB4CEekzs2lX+2bd8gPGkSdH+rfNl+41R/JVB
dyZhGDqkdf2tntH6jI/HfYiVkQISf4GaQ9Pwl+enEnoaew6Ocv+KLyNz3ca+tzkQ
ENyEZkNPJRGS028t8+LxFUZdN8675HpZFHWaoJPB68ysChbuvpfO6KFdGdAW6g9G
aJzue9IQQlmZmY+0QC3jGCazQacIDKomHFph1SibGcP8Acm3XL/L51suTtDOhZMT
VcjAzBw4vBT+iSLESNOGChGidarizvCVsFHDmSgJpOqf6Dv6uutRMnzFoEwVSBD4
syeA6fAzEIk2jKll/EPJiP8Qjs73gyHDibe3CWaDVRWTGDAvQu3k0Ak6HrgoL410
cFYd76xJXGbKuEKFyPoqg9LLT9FufxZE9ldsqOPlkRxoHoJSeZkeuAl7MQ76z9Hm
YdzghWk67XxsDlvEY3nstYreePpjowD8HLZJFX8aVM9RW3TS/rmp9S5JyHjrLS9m
CeyNGTwsgpTEwrKYBL0whbuUTJY+ozzeKiySmdzNKQIDAQABo1MwUTAdBgNVHQ4E
FgQUU1Wc9KUPX39zUbRl3WmdF2oSjzUwHwYDVR0jBBgwFoAUU1Wc9KUPX39zUbRl
3WmdF2oSjzUwDwYDVR0TAQH/BAUwAwEB/zANBgkqhkiG9w0BAQsFAAOCAgEAVYVQ
LSgC5PUM1vna+sSIR5wS5VNcWnHwNyHRVpxdARjxk7NbOwORj5tJqJz5xLP0RoHp
BkVNDMeZ4GZeUSWtjRCHObwm3yy75gr3r0HfO+4aT4cXXrXecI/BH/7NoHVlJK0A
T1qFISDKHawuh4HiX3+GVNHAxUqNhofzPIOaIQXl5FD2xWNdTTate1Q/mv/F2YPD
CeoqxIlIl+xDV/rexAo8m5OEeLyHoIN2nsTetw+K6n078Q1z8JOD7H4Y0csgKG+j
X3eeHAFi7xCFvlhGx2/N0xCO9LlNPx8foM18T1rlO8jZCAHoLphFgLb9RASPP24k
qelu/ZYM+LHoMh/h9E2F/hJTXEdelvphD535b0CdsJLCokDZRrGYlDmPVPEWtZol
hOlDddqeCV7tgUXlE8d1/1fty6gHhJxAb0GeUq/L9HD6fH71lYXflxqOkzqA4Ftu
2XMwMx14hXXtIpLMQdsulMUBDzpy63spuf5kPsXkKUDVJIkR7qyKOUyIbi7cJM5w
eZExOY1ttwme6qEz5+8KJxWPD3bdcweCaKD0xFnzsaSFZWWjPU2t7ENz8mLOI9KY
uZRUhY+DVFDMqahdIqgctHsXeedPa04G3SD/JRdzJWZORmHsfU9vcZjj8/jKfScv
+TH1fMyUSj3rCeQN1QnPLj4MddwCnSSaw1Cucsc=
-----END CERTIFICATE-----
Run the following command to get the fingerprint output in hexadecimal format:
sudo openssl x509 -in /etc/elasticsearch/certs/http_ca.crt -noout -sha256 -fingerprint | cut -d "=" -f 2 | sed 's/://g' | tr -d '\n' | awk '{print tolower($0)}'
f12d4244f06bb97c7fcbc94898f2b34c8d34e5b29bc5a75b9157c9f5d5f2d1d0
Open the filebeat configuration file located at /etc/filebeat/filebeat.yml.
sudo vim /etc/filebeat/filebeat.yml
Change the input configuration from false to true:
					  # Change to true to enable this input configuration.
  enabled: true
In the Kibana section of the configuration file, remove the comment to localhost and set it to the IP address of your Kibana instance (Kibana runs on our primary server so (NOTE: If your Kibana instance is running on the same server as Elasticsearch, skip this step):
					  # Kibana Host
  # Scheme and port can be left out and will be set to the default (http and 5601)
  # In case you specify and additional path, the scheme is required: http://localhost:5601/path
  # IPv6 addresses should always be defined as: https://[2001:db8::1]:5601
  host: "http://192.168.1.19:5601"
In the Elasticsearch output section, replace the localhost entry with the FQDN or IP address of the elasticsearch node (or nodes if you’re running a multi-node cluster):
					output.elasticsearch:
  # Array of hosts to connect to.
  hosts: ["https://vm1.naijalabs.net:9200"]
Also, uncomment the protocol entry and add the username and password for the Elasticsearch server.
					  # Protocol - either `http` (default) or `https`.
  protocol: "https"

  # Authentication credentials - either API key or username/password.
  #api_key: "id:api_key"
  username: "elastic"
  password: "AFc*jflYr3OW1xYATgCP"
Append the following entries as well and add the ca_trusted_fingerprint entry (from the Obtain CA Fingerprint Section):
					  # Authentication credentials - either API key or username/password.
  #api_key: "id:api_key"
  username: "elastic"
  password: "vXvNwobHdHYE=8Mk4lFm"
  ssl:
    enabled: true
    ca_trusted_fingerprint: "f12d4244f06bb97c7fcbc94898f2b34c8d34e5b29bc5a75b9157c9f5d5f2d1d0"
Save and quit the file.
To list all modules available to Filebeat, run the following command (nothing is Enabled by default):
sudo filebeat modules list
					Enabled:

Disabled:
activemq
apache
auditd
aws
awsfargate
azure
barracuda
bluecoat
cef
checkpoint
cisco
coredns
crowdstrike
cyberarkpas
cylance
elasticsearch
envoyproxy
f5
fortinet
... output ommitted for brevity ...
Enable the filebeat module for Elasticsearch:
sudo filebeat modules enable elasticsearch
Next, open the elasticsearch module configuration file (/etc/filebeat/modules.d/elasticsearch.yml):
sudo vim /etc/filebeat/modules.d/elasticsearch.yml
Change the enabled setting to true for the server logs. Uncomment the -var.paths: variable. Then, include the path to the Elasticsearch logs.
					# Module: elasticsearch
# Docs: https://www.elastic.co/guide/en/beats/filebeat/8.12/filebeat-module-elasticsearch.html

- module: elasticsearch
  # Server log
  server:
    enabled: true

    # Set custom paths for the log files. If left empty,
    # Filebeat will choose the paths depending on your OS.
    var.paths:
      - /var/log/elasticsearch/*.json
      - /var/log/elasticsearch/*_server.json
Save and quit the file. Then, execute the following command(s) to test your configuration file.
cd /etc/filebeat; sudo /usr/share/filebeat/bin/filebeat test config -e
					...omitted for brevity...
{"log.level":"info","@timestamp":"2024-03-14T16:54:20.321-0400","log.logger":"esclientleg","log.origin":{"function":"github.com/elastic/beats/v7/libbeat/esleg/eslegclient.NewConnection","file.name":"eslegclient/connection.go","file.line":122},"message":"elasticsearch url: https://vm1.naijalabs.net:9200","service.name":"filebeat","ecs.version":"1.6.0"}
{"log.level":"info","@timestamp":"2024-03-14T16:54:20.322-0400","log.logger":"publisher","log.origin":{"function":"github.com/elastic/beats/v7/libbeat/publisher/pipeline.LoadWithSettings","file.name":"pipeline/module.go","file.line":105},"message":"Beat name: vm1.naijalabs.net","service.name":"filebeat","ecs.version":"1.6.0"}
{"log.level":"error","@timestamp":"2024-03-14T16:54:20.322-0400","log.logger":"modules","log.origin":{"function":"github.com/elastic/beats/v7/filebeat/fileset.NewModuleRegistry","file.name":"fileset/modules.go","file.line":152},"message":"Not loading modules. Module directory not found: /usr/share/filebeat/bin/module","service.name":"filebeat","ecs.version":"1.6.0"}
Config OK
Execute the following command to initiate the setup:
sudo filebeat setup -e
This process will take a minute or two to complete as Filebeat sets up the Indexing, Kibana dashboards and Ingest pipelines.
					...omitted for brevity...
{"log.level":"info","@timestamp":"2024-03-14T17:15:19.931-0400","log.logger":"load","log.origin":{"function":"github.com/elastic/beats/v7/libbeat/cfgfile.(*RunnerList).Stop","file.name":"cfgfile/list.go","file.line":188},"message":"Stopping 68 runners ...","service.name":"filebeat","ecs.version":"1.6.0"}
Loaded Ingest pipelines
Inform systemd of the configuration changes. Then, start and enable the filebeat service:
sudo systemctl daemon-reload; sudo systemctl enable --now filebeat
Run a status check to verify Filebeat is running without errors:
sudo systemctl status filebeat
					● filebeat.service - Filebeat sends log files to Logstash or directly to Elasticsearch.
     Loaded: loaded (/usr/lib/systemd/system/filebeat.service; enabled; preset: disabled)
     Active: active (running) since Thu 2024-03-14 17:24:20 EDT; 6s ago
       Docs: https://www.elastic.co/beats/filebeat
   Main PID: 22953 (filebeat)
      Tasks: 11 (limit: 35960)
     Memory: 46.7M
        CPU: 376ms
     CGroup: /system.slice/filebeat.service
             └─22953 /usr/share/filebeat/bin/filebeat --environment systemd -c /etc/filebeat/filebeat.yml --path.home /usr/share/filebeat --path.config /etc/filebeat --path.data /var/lib/filebeat --path.logs /v>

Mar 14 17:24:23 vm1.naijalabs.net filebeat[22953]: {"log.level":"info","@timestamp":"2024-03-14T17:24:23.875-0400","log.logger":"tls","log.origin":{"function":"github.com/elastic/elastic-agent-libs/transport/tl>
Mar 14 17:24:23 vm1.naijalabs.net filebeat[22953]: {"log.level":"info","@timestamp":"2024-03-14T17:24:23.875-0400","log.logger":"tls","log.origin":{"function":"github.com/elastic/elastic-agent-libs/transport/tl>
Mar 14 17:24:23 vm1.naijalabs.net filebeat[22953]: {"log.level":"info","@timestamp":"2024-03-14T17:24:23.883-0400","log.logger":"esclientleg","log.origin":{"function":"github.com/elastic/beats/v7/libbeat/esleg/>
Mar 14 17:24:23 vm1.naijalabs.net filebeat[22953]: {"log.level":"info","@timestamp":"2024-03-14T17:24:23.885-0400","log.logger":"esclientleg","log.origin":{"function":"github.com/elastic/beats/v7/libbeat/esleg/>
Mar 14 17:24:23 vm1.naijalabs.net filebeat[22953]: {"log.level":"info","@timestamp":"2024-03-14T17:24:23.886-0400","log.logger":"index-management","log.origin":{"function":"github.com/elastic/beats/v7/libbeat/i>
Mar 14 17:24:23 vm1.naijalabs.net filebeat[22953]: {"log.level":"info","@timestamp":"2024-03-14T17:24:23.936-0400","log.logger":"index-management.ilm","log.origin":{"function":"github.com/elastic/beats/v7/libbe>
Mar 14 17:24:23 vm1.naijalabs.net filebeat[22953]: {"log.level":"info","@timestamp":"2024-03-14T17:24:23.936-0400","log.logger":"index-management","log.origin":{"function":"github.com/elastic/beats/v7/libbeat/i>
Mar 14 17:24:23 vm1.naijalabs.net filebeat[22953]: {"log.level":"info","@timestamp":"2024-03-14T17:24:23.962-0400","log.logger":"template_loader","log.origin":{"function":"github.com/elastic/beats/v7/libbeat/te>
Mar 14 17:24:23 vm1.naijalabs.net filebeat[22953]: {"log.level":"info","@timestamp":"2024-03-14T17:24:23.962-0400","log.logger":"index-management","log.origin":{"function":"github.com/elastic/beats/v7/libbeat/i>
Mar 14 17:24:23 vm1.naijalabs.net filebeat[22953]: {"log.level":"info","@timestamp":"2024-03-14T17:24:23.971-0400","log.logger":"publisher_pipeline_output","log.origin":{"function":"github.com/elastic/beats/v7/
Well done! We’ve successfully installed and configured Filebeat on our Elasticsearch (main) server. Now, let’s head over to Kibana to view the logs.
Navigate to Stack Monitoring (bottom-left corner) to begin:
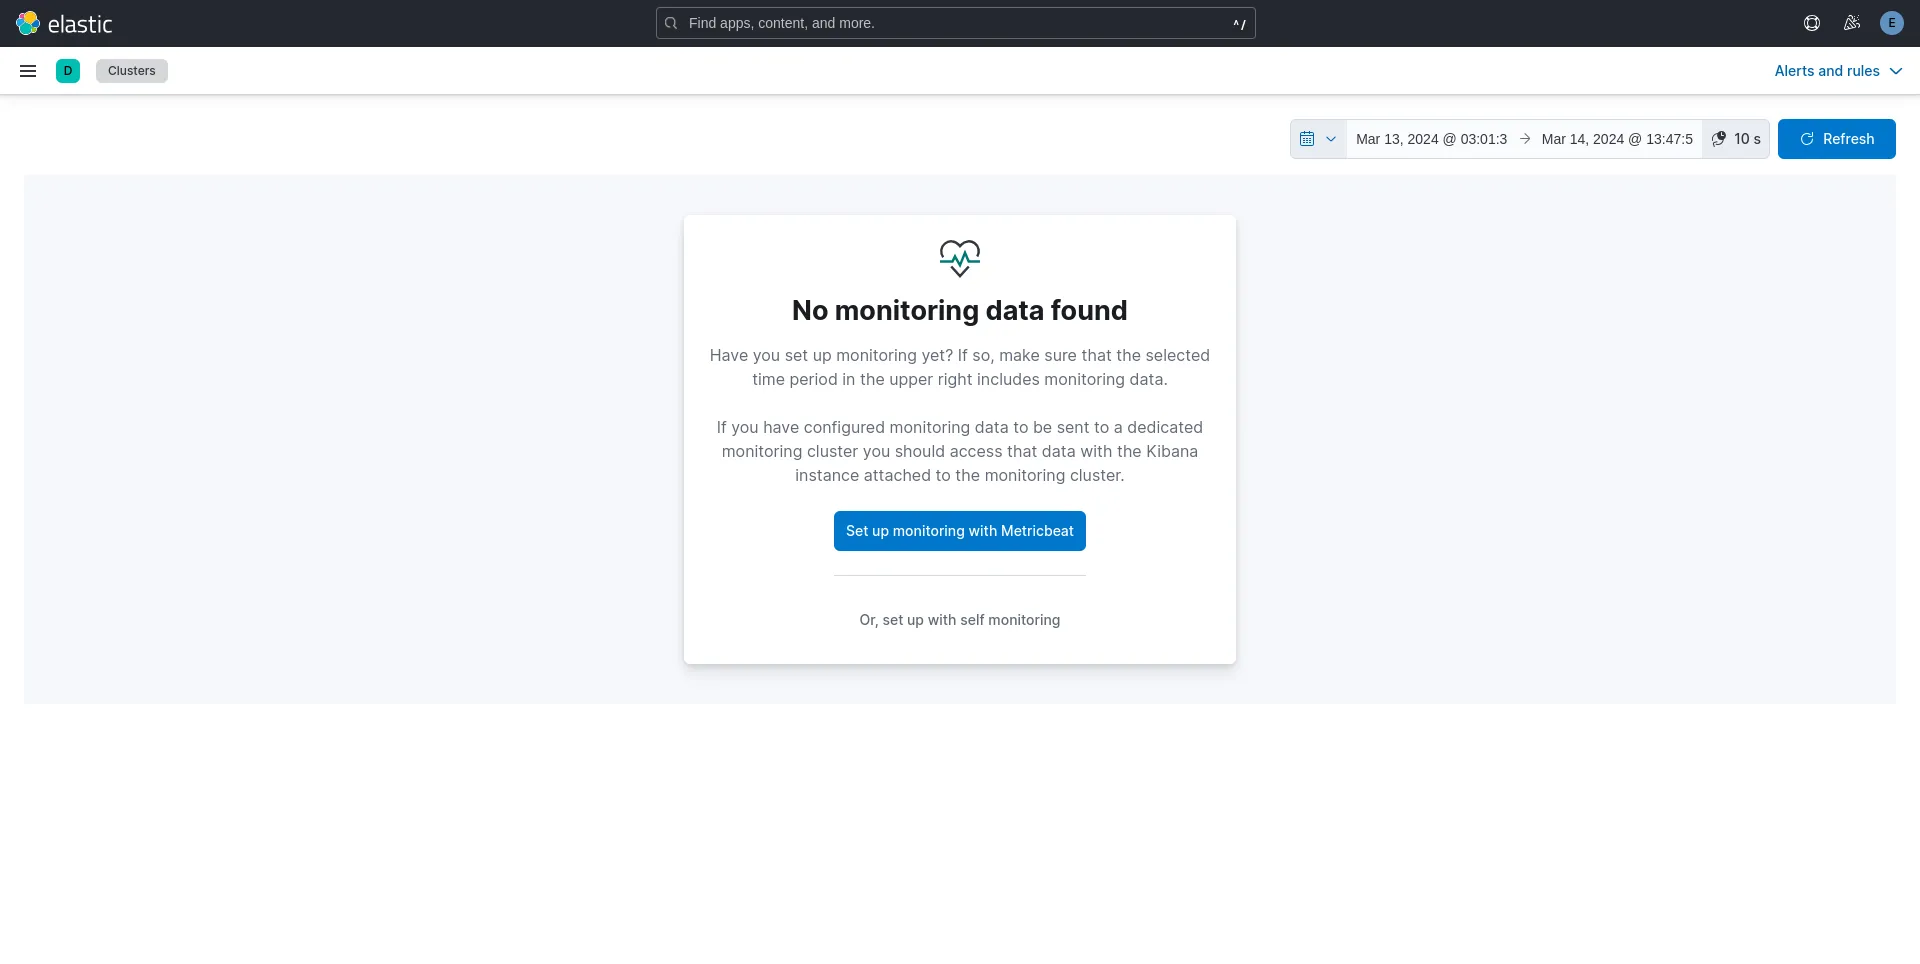
Photo by admingeek from Infotechys
We expect to see this page since it’s our first time and we just set up monitoring with Filebeat. Therefore, click the calendar icon and select “Last 15 minutes” from the drop-down menu.
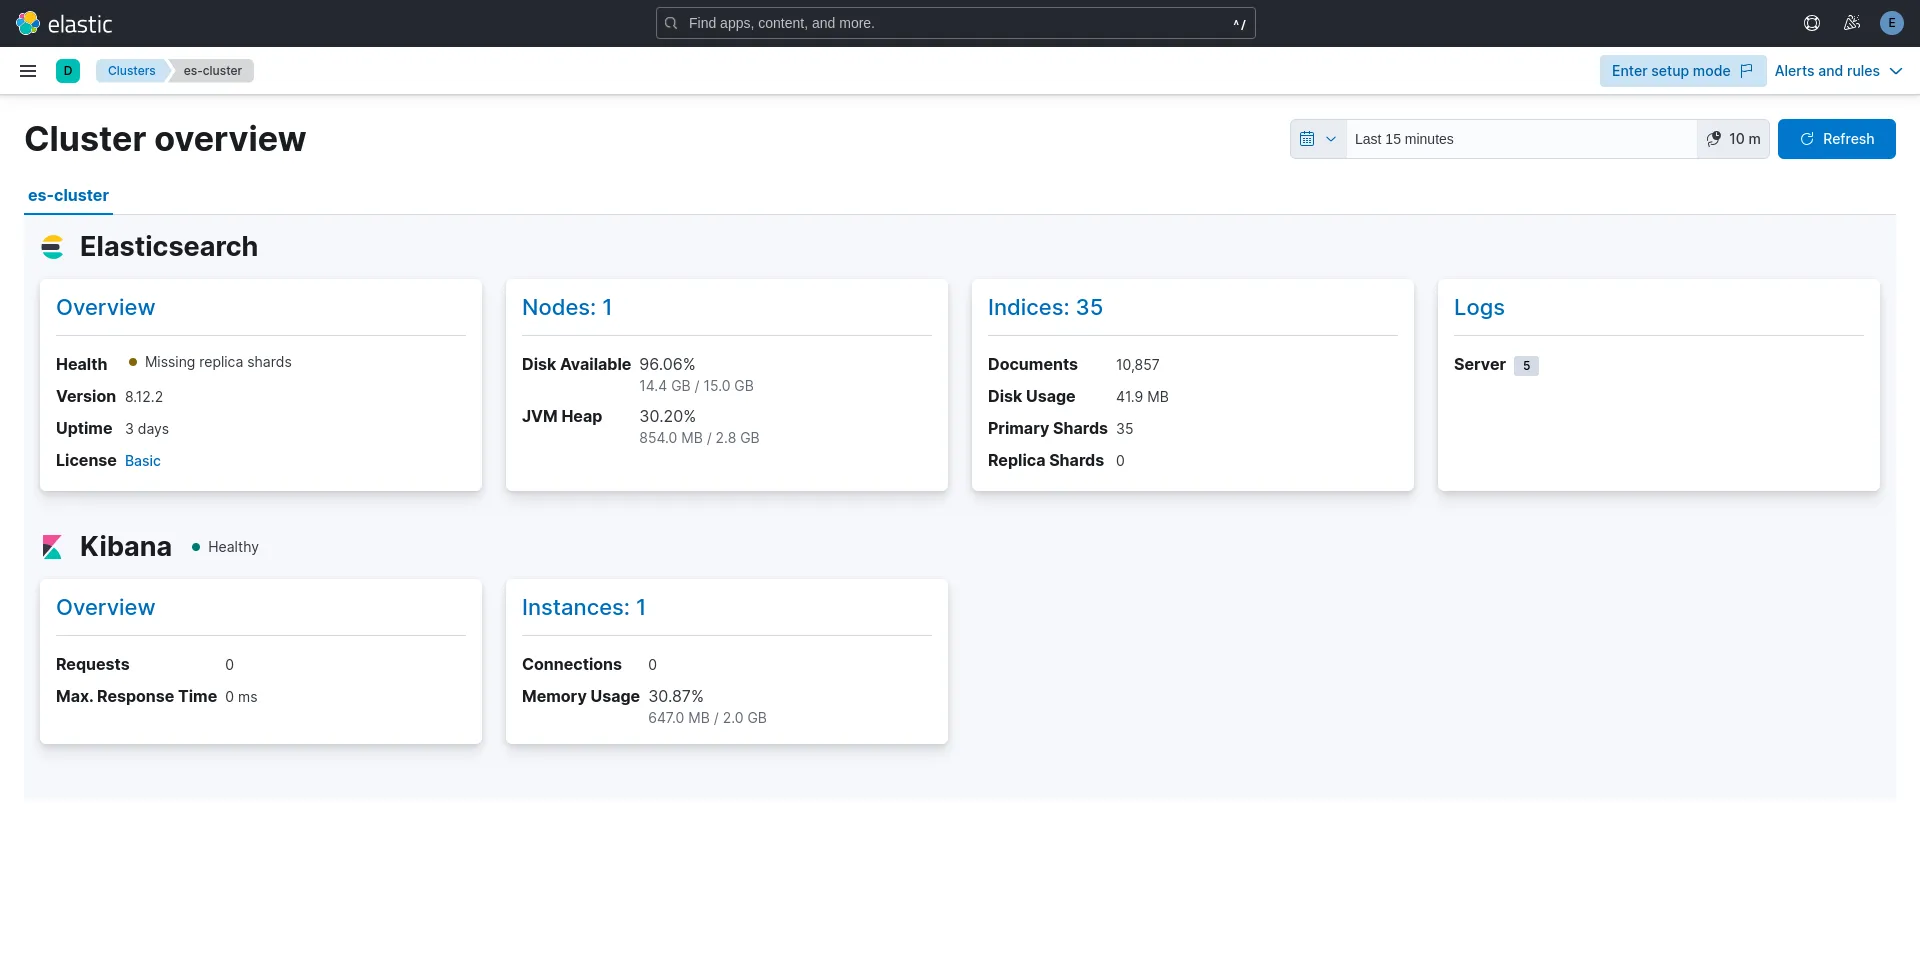
Photo by admingeek from Infotechys
Observe that server logs are now available under the Logs link on the “Cluster Overview” page. Click the Logs link to continue:
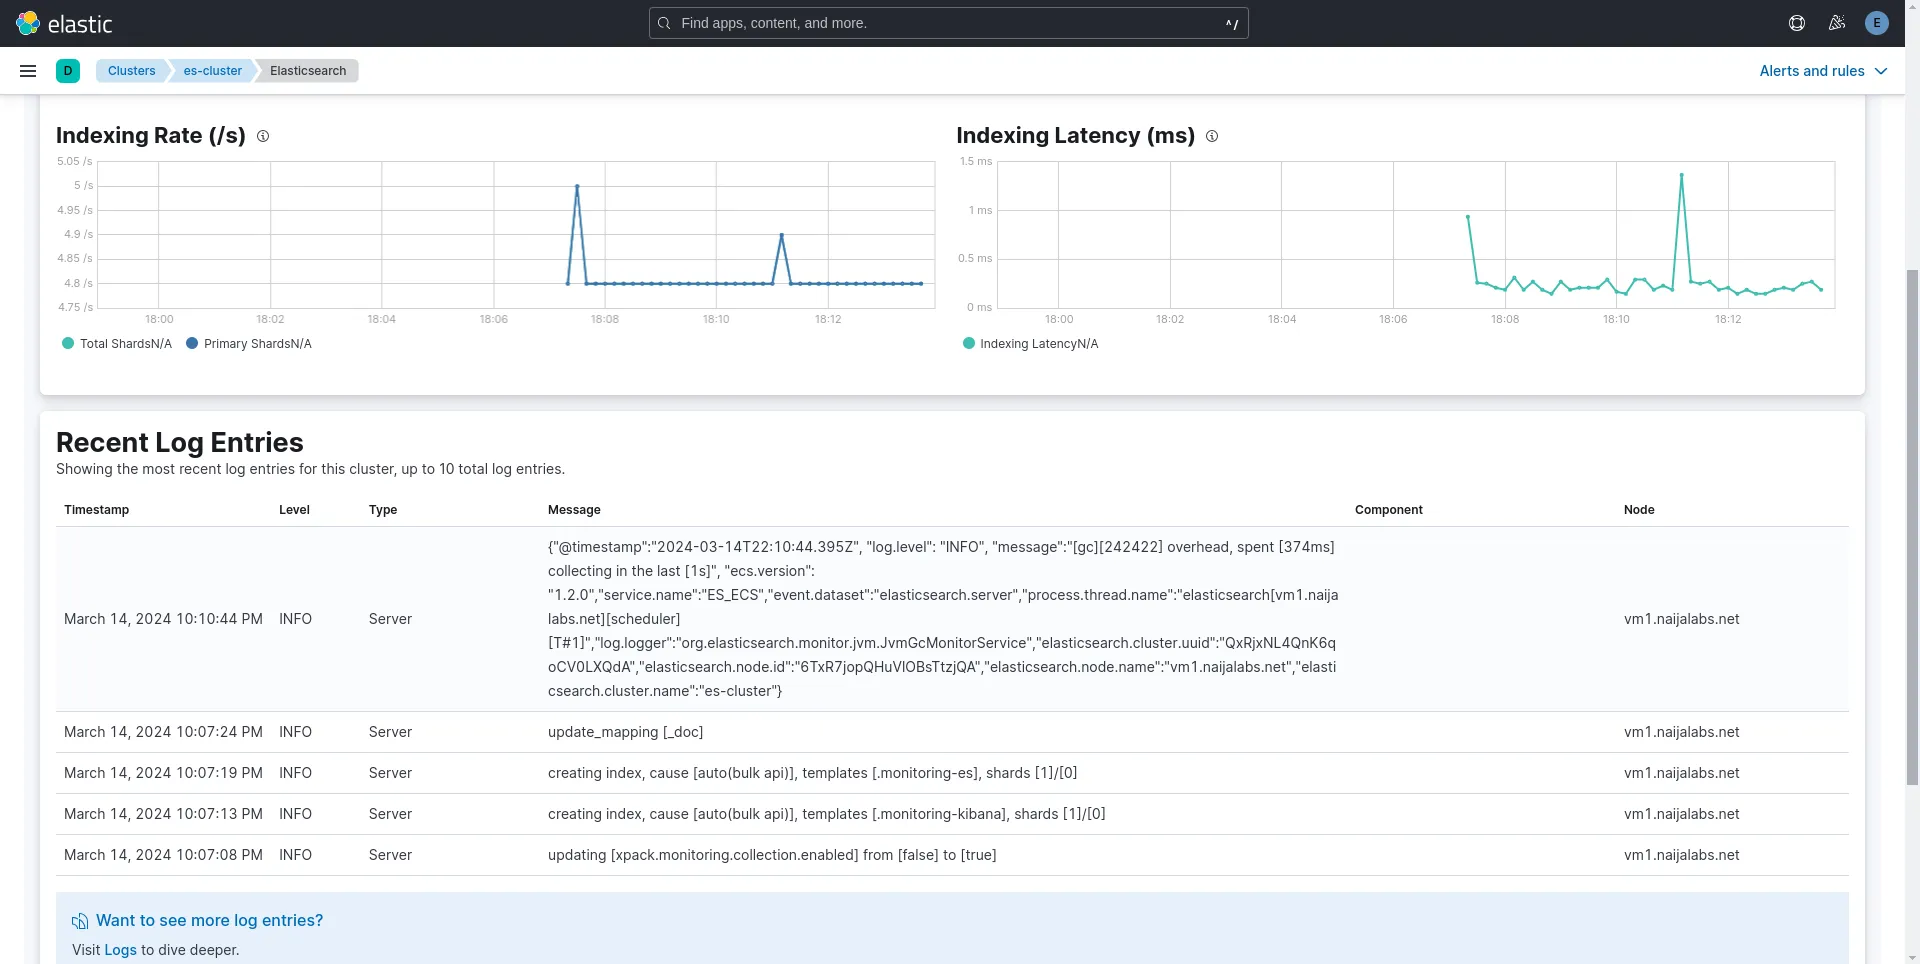
Photo by admingeek from Infotechys
Notice the “Recent Log Entries” section displays the recently-generated server logs. Refer to the Kibana Elasticsearch Monitoring Metrics Documentation for further insights and to discover additional tips and features.
Installing the ELK stack on RHEL 9 or CentOS 9 is a straightforward process that can be completed in just a few simple steps. By following the steps outlined in this guide, you can quickly set up a powerful data management and analysis platform to help drive your organization forward. Whether you’re dealing with server logs, application logs, or any other type of data, the ELK stack provides the tools you need to gain valuable insights and make informed decisions.
Did you find this article useful? Your feedback is invaluable to us! Please feel free to share your thoughts in the comments section below.
Here are some helpful links to help you along your journey to mastering the ELK stack!
| Google Cloud Documentation | Parser Syntax Reference |
| Github Elasticsearch Repository | Grok Patterns |
| Elasticsearch Documentation | Official ELK stack documentation |
Related Posts
In this guide, we’ll walk you through the process of setting up a Caddy server using Podman, empowering you to host your websites with confidence.

In this comprehensive guide, we’ll walk you through the process of creating and deploying a LAMP stack on Minikube, a tool that enables you to

In this comprehensive guide, we’ll explore step-by-step how to install LAMP stack on Ubuntu 23.10, ensuring you have the foundation to power your web projects