How to Secure Grafana Behind Nginx with SSL on RHEL 9 | CentOS 9

Secure Grafana behind Nginx SSL on RHEL 9

Learn how to secure Grafana behind Nginx with SSL on RHEL 9 / CentOS 9. This step-by-step blog post includes domain setup, reverse-proxy configuration, WebSocket support, firewall rules and troubleshooting tips.

Table of Contents

šŸ”ˆIntroduction

Securing your Grafana instance behind Nginx with SSL is a best-practice setup that ensures encrypted web traffic, clean domain-based access, and the ability to place Grafana behind a reverse-proxy for firewalls or load-balancers. This guide walks through the steps for servers running Red Hat Enterprise Linux 9 or CentOS 9 (or equivalents such as CentOS Stream 9).


āœ… Why secure Grafana?

RiskDescriptionBenefit of SSL + proxy
Clear-text credentialsGrafana by default runs on HTTP (port 3000) which may expose login data in transit.SSL encrypts the traffic.
Unrestricted direct accessLeaving Grafana reachable on port 3000 exposes it to the internet.A reverse proxy lets you restrict access (e.g., only port 443, allowlist IP, etc).
Mixed-content or link mis-routingIf Grafana isn’t aware of its public URL, redirects or asset links may fail.Configuring root_url and protocol ensures correct behavior.

šŸ”§ Prerequisites

  • āœ… A server running RHEL 9 or CentOS 9 with root (or sudo) access.
  • āœ… A domain name (e.g., grafana.example.com) pointing to your server’s public IP.
  • āœ… A valid SSL certificate for that domain (for example via Certbot and Let’s Encrypt).
  • āœ… Grafana installed and running (default port 3000).
šŸ’”NOTE: Replace example.com with your actual domain name. For this demonstration, we’ll be using dev.naijalabs.net.

šŸ“¤ Step 1: Install Grafana and Nginx

ā–¶ļø Grafana

				
					# Add Grafana repository  
sudo tee /etc/yum.repos.d/grafana.repo <<EOF
[grafana]
name=Grafana
baseurl=https://packages.grafana.com/oss/rpm
repo_gpgcheck=1
enabled=1
gpgcheck=1
gpgkey=https://packages.grafana.com/gpg.key
sslverify=1
sslcacert=/etc/pki/tls/certs/ca-bundle.crt
EOF


					# Install Grafana  
sudo dnf install -y grafana


					# Start & enable the service  
sudo systemctl enable --now grafana-server


ā–¶ļø Nginx

				
					sudo dnf install -y nginx


					sudo systemctl enable --now nginx


Open any required firewall ports:

				
					sudo firewall-cmd --permanent --add-service=http


					sudo firewall-cmd --permanent --add-service=https


					sudo firewall-cmd --reload


šŸ“¤ Step 2: Obtain SSL certificate

Using Certbot (Let’s Encrypt):

				
					sudo dnf install -y certbot python3-certbot-nginx


					sudo certbot --nginx -d grafana.dev.naijalabs.net


This configures Nginx for SSL (port 443) automatically. Ensure auto-renewal is enabled (Certbot typically sets it up). After certificate issuance, the chain and key will be in /etc/letsencrypt/live/grafana.dev.naijalabs.net/.


šŸ“¤ Step 3: Configure Grafana for reverse proxy

Edit /etc/grafana/grafana.ini (or override with GF_ env-vars if using container):

				
					[server]
# public facing domain (required for redirects)
domain = grafana.dev.naijalabs.net
root_url = https://grafana.dev.naijalabs.net/
protocol = http


Because Nginx handles SSL, you keep Grafana’s protocol = http. Then restart Grafana:

				
					sudo systemctl restart grafana-server


šŸ“¤ Step 4: Configure Nginx reverse-proxy

Create/edit Nginx server block, e.g., /etc/nginx/conf.d/grafana.conf:

				
					server {
    listen 80;
    server_name grafana.dev.naijalabs.net;
    return 301 https://$host$request_uri;
}

server {
    listen 443 ssl http2;
    server_name grafana.dev.naijalabs.net;

    ssl_certificate     /etc/letsencrypt/live/grafana.dev.naijalabs.net/fullchain.pem;
    ssl_certificate_key /etc/letsencrypt/live/grafana.dev.naijalabs.net/privkey.pem;
    include             /etc/letsencrypt/options-ssl-nginx.conf;
    ssl_dhparam         /etc/letsencrypt/ssl-dhparams.pem;

    # proxy settings
    location / {
        proxy_pass       http://localhost:3000/;
        proxy_set_header Host              $host;
        proxy_set_header X-Real-IP         $remote_addr;
        proxy_set_header X-Forwarded-For   $proxy_add_x_forwarded_for;
        proxy_set_header X-Forwarded-Proto $scheme;

        # WebSocket support for Grafana Live  
        proxy_http_version 1.1;
        proxy_set_header   Upgrade          $http_upgrade;
        proxy_set_header   Connection       $connection_upgrade;
    }
}


This mirrors recommended reverse-proxy settings for Grafana behind Nginx. After saving, test and reload:

				
					sudo nginx -t && sudo systemctl reload nginx
				
			
Secure Grafana behind Nginx SSL on RHEL 9

Photo by admingeek from Infotechys

ā–¶ļø SELinux Denials

This is expected when running Grafana behind Nginx on RHEL 9 / CentOS 9, because SELinux, by default, does not permit Nginx (httpd_t) to make outbound network connections.Ā The fix is simple, and you do not need to generate a custom SELinux module unless you want extremely fine-grained control. Run the following command:

				
					sudo setsebool -P httpd_can_network_connect 1


This SELinux boolean allows Nginx/Apache to initiate outbound network connections—required for reverse-proxy setups such as Nginx → Grafana.


šŸ“¤ Step 5: (Optional) Restrict access and secure further

  • Restrict access by IP or VPN:
				
					allow 10.0.0.0/8;
deny all;
				
			
  • Enable HTTP-Strict-Transport-Security (HSTS) header:
				
					add_header Strict-Transport-Security "max-age=31536000; includeSubDomains; preload" always;
				
			
  • Disable Grafana’s direct access to port 3000 on public interface:
				
					sudo firewall-cmd --permanent --add-rich-rule='rule family="ipv4" port port="3000" protocol="tcp" reject'


					sudo firewall-cmd --reload
				
			
  • Change default Grafana admin password and enforce secure passwords.
Secure Grafana behind Nginx SSL on RHEL 9

Photo by admingeek from Infotechys


🧰 Troubleshooting common issues

IssueLikely causeSolution
Redirect loop or login failureGrafana root_url or protocol misconfigured for proxyEnsure root_url = https://your.domain/ and protocol = http (if proxy handles SSL)
WebSocket/live data errorsMissing WebSocket proxy headersConfirm proxy_set_header Upgrade and Connection $connection_upgrade are set.
SSL certificate not found or invalidCertificate paths incorrect or expiredVerify files in /etc/letsencrypt/live/…/; run certbot renew --dry-run
Direct access to port 3000 still publicly visibleFirewall or service not restrictedBind Grafana to 127.0.0.1:3000 or block port via firewall
Assets not loading (404/403) when served under sub-pathSub-path configuration missing in both Nginx and GrafanaUse location /subpath/ { … rewrite ^/subpath/(.*) /$1 break; … } and set serve_from_sub_path = true if needed

šŸ“Œ Summary

By installing Grafana on RHEL 9 / CentOS 9, configuring Nginx for SSL termination and reverse-proxying, and adjusting Grafana’s grafana.ini to reflect the public domain and protocol, you establish a secure and professional deployment. The steps in this post provide a clear, inclusive workflow that balances brevity with completeness.

With encryption, domain-based access, WebSocket compatibility and the ability to enforce tighter access controls, your Grafana installation is ready for production usage with peace of mind.

Did you find this article helpful? Your feedback is invaluable to us! Feel free to share this post with those who may benefit, and let us know your thoughts in the comments section below.


šŸ“• Related Posts
Deploy NGINX on Kubernetes
Commands
Deploy NGINX on Kubernetes

Learn how to deploy NGINX onĀ Kubernetes with our comprehensive step-by-step guide. Enhance your application deployment with scalable and reliable solutions, complete with YAML examples, advanced
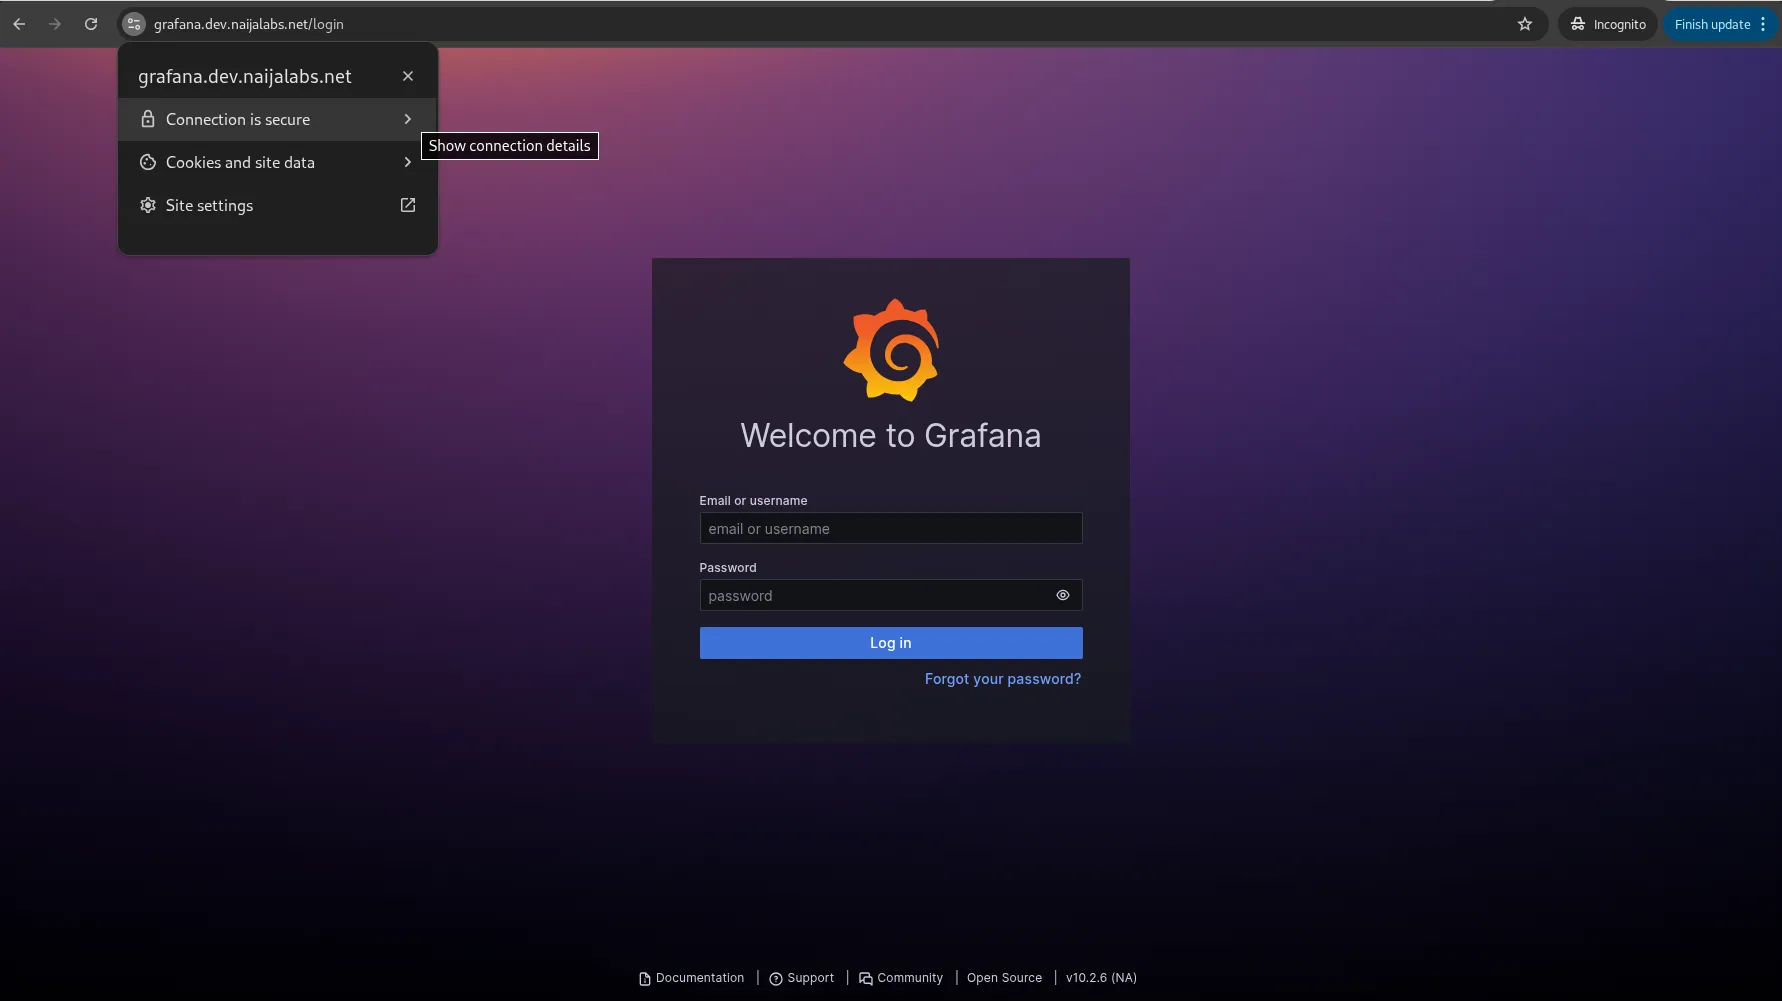
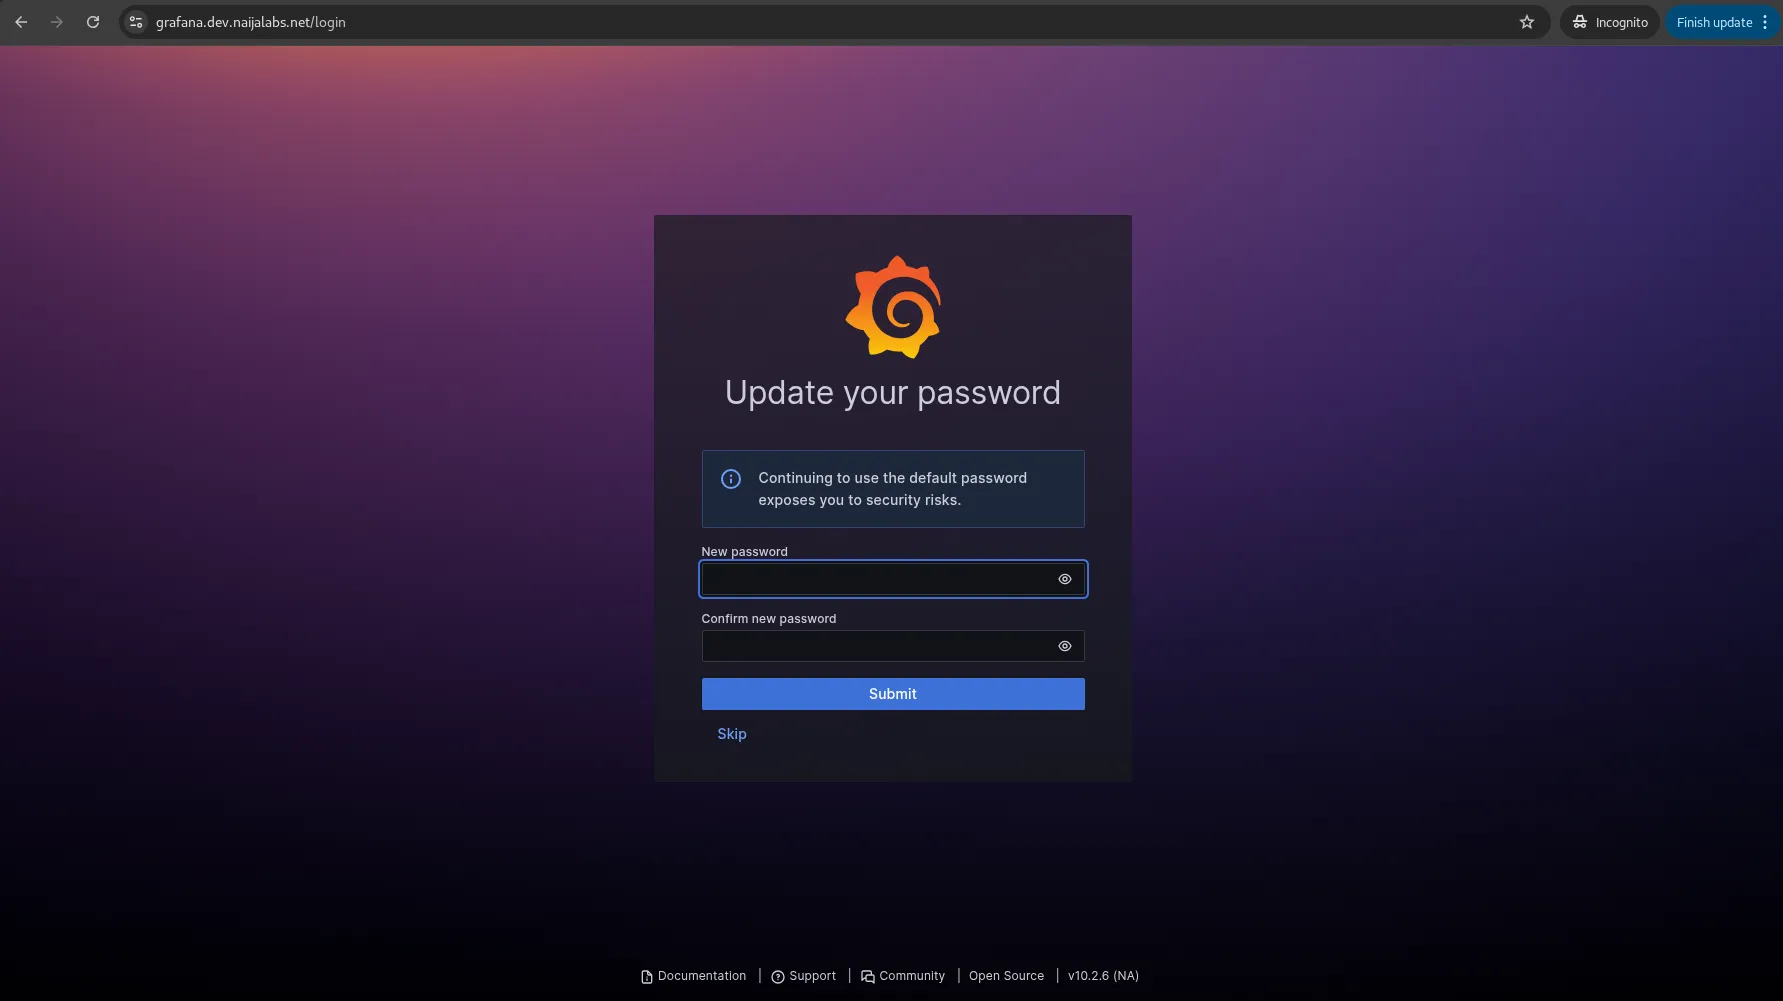
Read More Ā»

Leave a Reply

Your email address will not be published. Required fields are marked *