
Commands
This blog post covers how to install and configure Zabbix version 7.0-2 on RHEL 9 in detail, including prerequisites, step-by-step instructions, and troubleshooting tips. Table


Learn how to install Grafana on RHEL 9 or CentOS 9—from repository setup through installation, service management, firewall & SELinux configuration, to securing your Grafana environment.
If you’re working with Grafana and running a modern enterprise Linux environment like Red Hat Enterprise Linux 9 (RHEL 9) or CentOS Stream 9 (or a compatible EL9 distribution), this guide walks you through installing Grafana in a clear, inclusive, step-by-step way. We’ll cover prerequisites, repository setup, installation, startup, initial configuration and securing your setup. At the end you’ll be ready to access the Grafana UI, add data sources, and build dashboards. Let’s dive in.
Grafana is a powerful open-source (with optional enterprise features) analytics and monitoring platform used to query, visualize and alert on metrics, logs and traces from many sources. It supports time-series databases like Prometheus, InfluxDB, and traditional relational stores, and offers a flexible dashboarding environment.
Choosing RHEL 9 / CentOS 9 means you have a modern, supported kernel and user-space, along with recent dependencies such as systemd, dnf, updated crypto policies and SELinux support.
💡Note: While RHEL 9 includes a version of Grafana via official repos, the version may be older — for example as of the date of this publication, RHEL 9 ships with grafana version 10.2.6. To get the latest or Enterprise version of Grafana, you’ll typically install via Grafana’s own RPM repository. |
Using Grafana’s own repository instead of relying solely on the default distribution repo ensures you get the most up-to-date version and patches. Run the following commands:
wget -q -O /tmp/grafana_gpg.key https://rpm.grafana.com/gpg.key
sudo rpm --import /tmp/grafana_gpg.key
					sudo tee /etc/yum.repos.d/grafana.repo << EOF
[grafana]
name=Grafana
baseurl=https://rpm.grafana.com
repo_gpgcheck=1
enabled=1
gpgcheck=1
gpgkey=https://rpm.grafana.com/gpg.key
sslverify=1
sslcacert=/etc/pki/tls/certs/ca-bundle.crt
EOF
This configures the Grafana OSS repository. If you do not intend to install the Enterprise version, you may skip this step.
Once the repo is configured, install Grafana:
sudo dnf install grafana -y
If you prefer the enterprise edition:
sudo dnf install grafana-enterprise -y
After installation the package will include grafana-server, grafana-cli, the web UI and default configuration in /etc/grafana/grafana.ini. The official documentation describes this method for RHEL/Fedora/EL systems. Run the following command to check the version:
grafana server --version
Version 10.2.6 (commit: NA, branch: main)
You should see the installed version printed (e.g., Version 10.2.6, depending on release).
🛑 Deprecation warning: The standalone ‘grafana-server’ program is deprecated and will be removed in the future. Update all uses of ‘grafana-server’ to ‘grafana server’. |
Enable and start the Grafana service so it runs at boot:
sudo systemctl enable --now grafana-server
Check status:
sudo systemctl status grafana-server
					● grafana-server.service - Grafana instance
     Loaded: loaded (/usr/lib/systemd/system/grafana-server.service; enabled; preset: disabled)
     Active: active (running) since Mon 2025-11-10 21:08:37 EST; 38min ago
       Docs: http://docs.grafana.org
   Main PID: 944 (grafana)
      Tasks: 18 (limit: 23109)
     Memory: 236.5M
        CPU: 3.311s
     CGroup: /system.slice/grafana-server.service
             ├─ 944 /usr/sbin/grafana server --config=/etc/grafana/grafana.ini --pidfile=/var/run/grafana/grafana-server.pid --packaging=rpm cfg:default.paths.logs=/var/log/grafana cfg:de>
             └─1522 /usr/share/performancecopilot-pcp-app/datasources/redis/pcp_redis_datasource_linux_amd64
...omitted for brevity...
You should see something like: “active (running)”. Then, verify the listening port (default is 3000):
ss -ntlp | grep 3000
LISTEN 0 4096 *:3000 *:* users:(("grafana",pid=944,fd=12))
If it shows LISTEN and the process "grafana" then we are good.
🔹 Firewall (using |
If you’re using firewalld, open port 3000:
sudo firewall-cmd --permanent --add-port=3000/tcp && sudo firewall-cmd --reload
🔹 SELinux |
By default, SELinux should allow the grafana-server service to bind port 3000 (since it’s using the default settings), but if you have customized SELinux policies, ensure grafana-server is allowed to open network ports. If you see AVC denials in audit.log, you may need SELinux adjustments (e.g., audit2allow).
Access the Grafana web UI by opening (http://<your_server_IP_or_hostname>:3000):
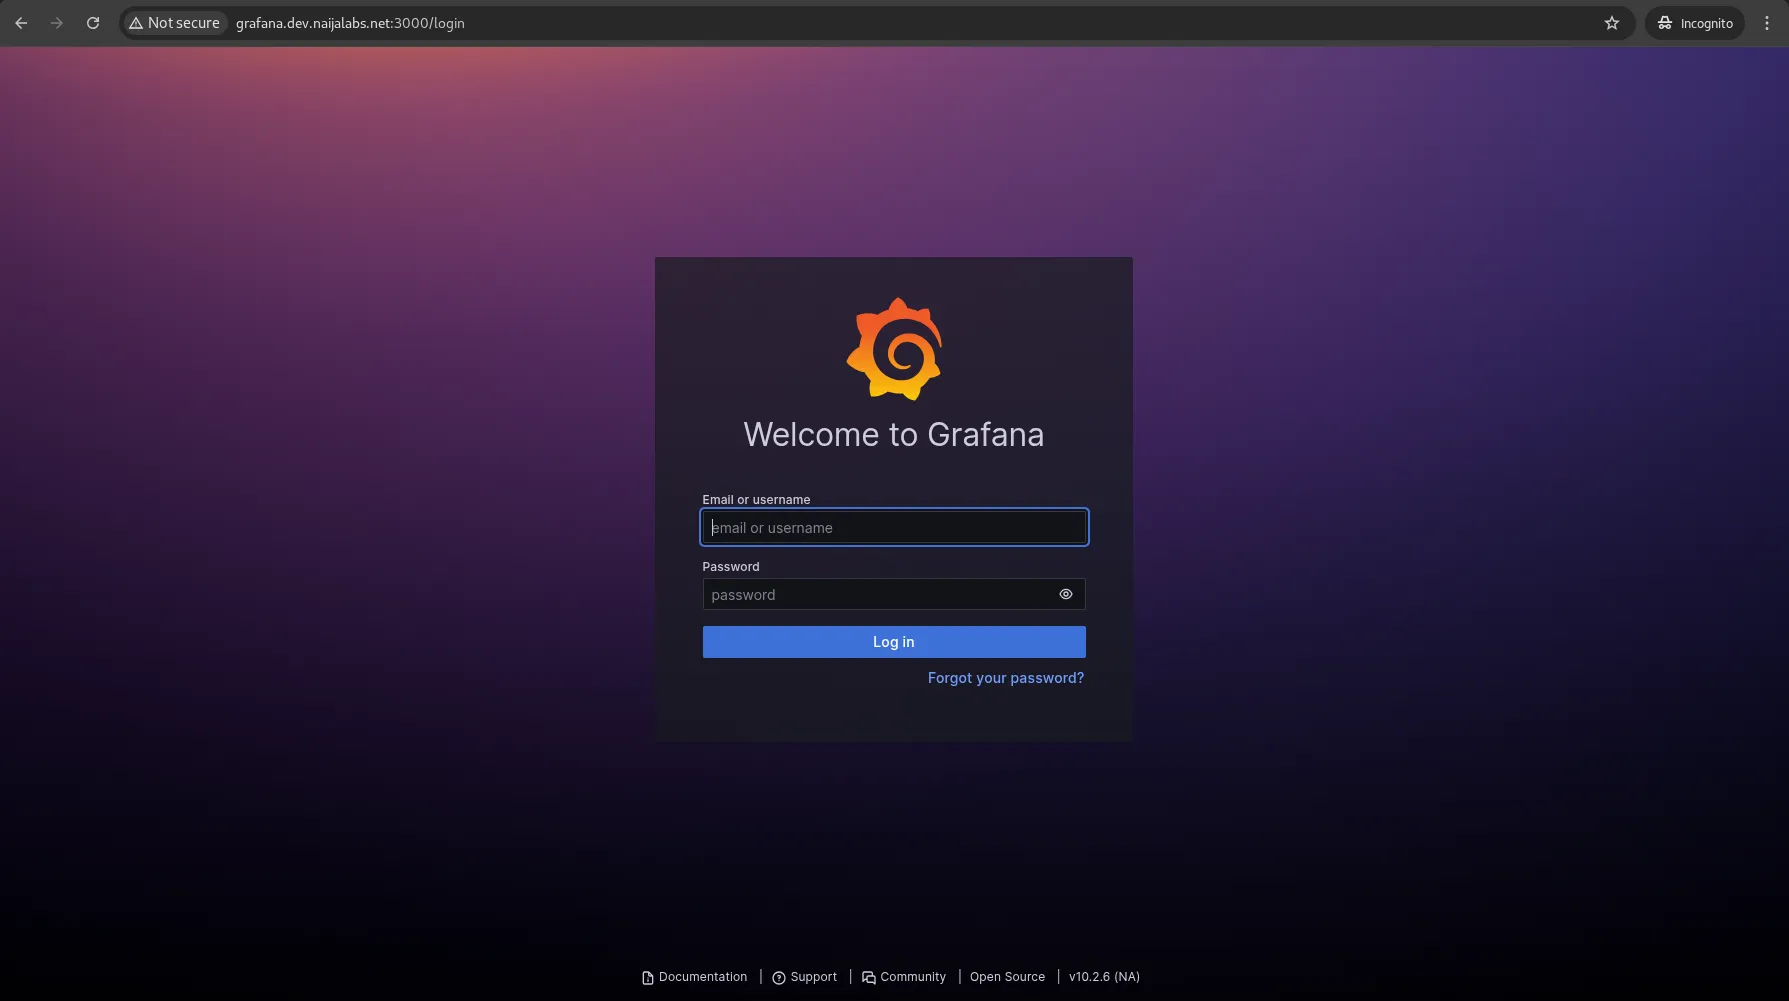
Photo by admingeek from Infotechys
The default login credentials are:
|
|
You will be prompted to change the password at first login. You may do so or skip to continue with default credentials.
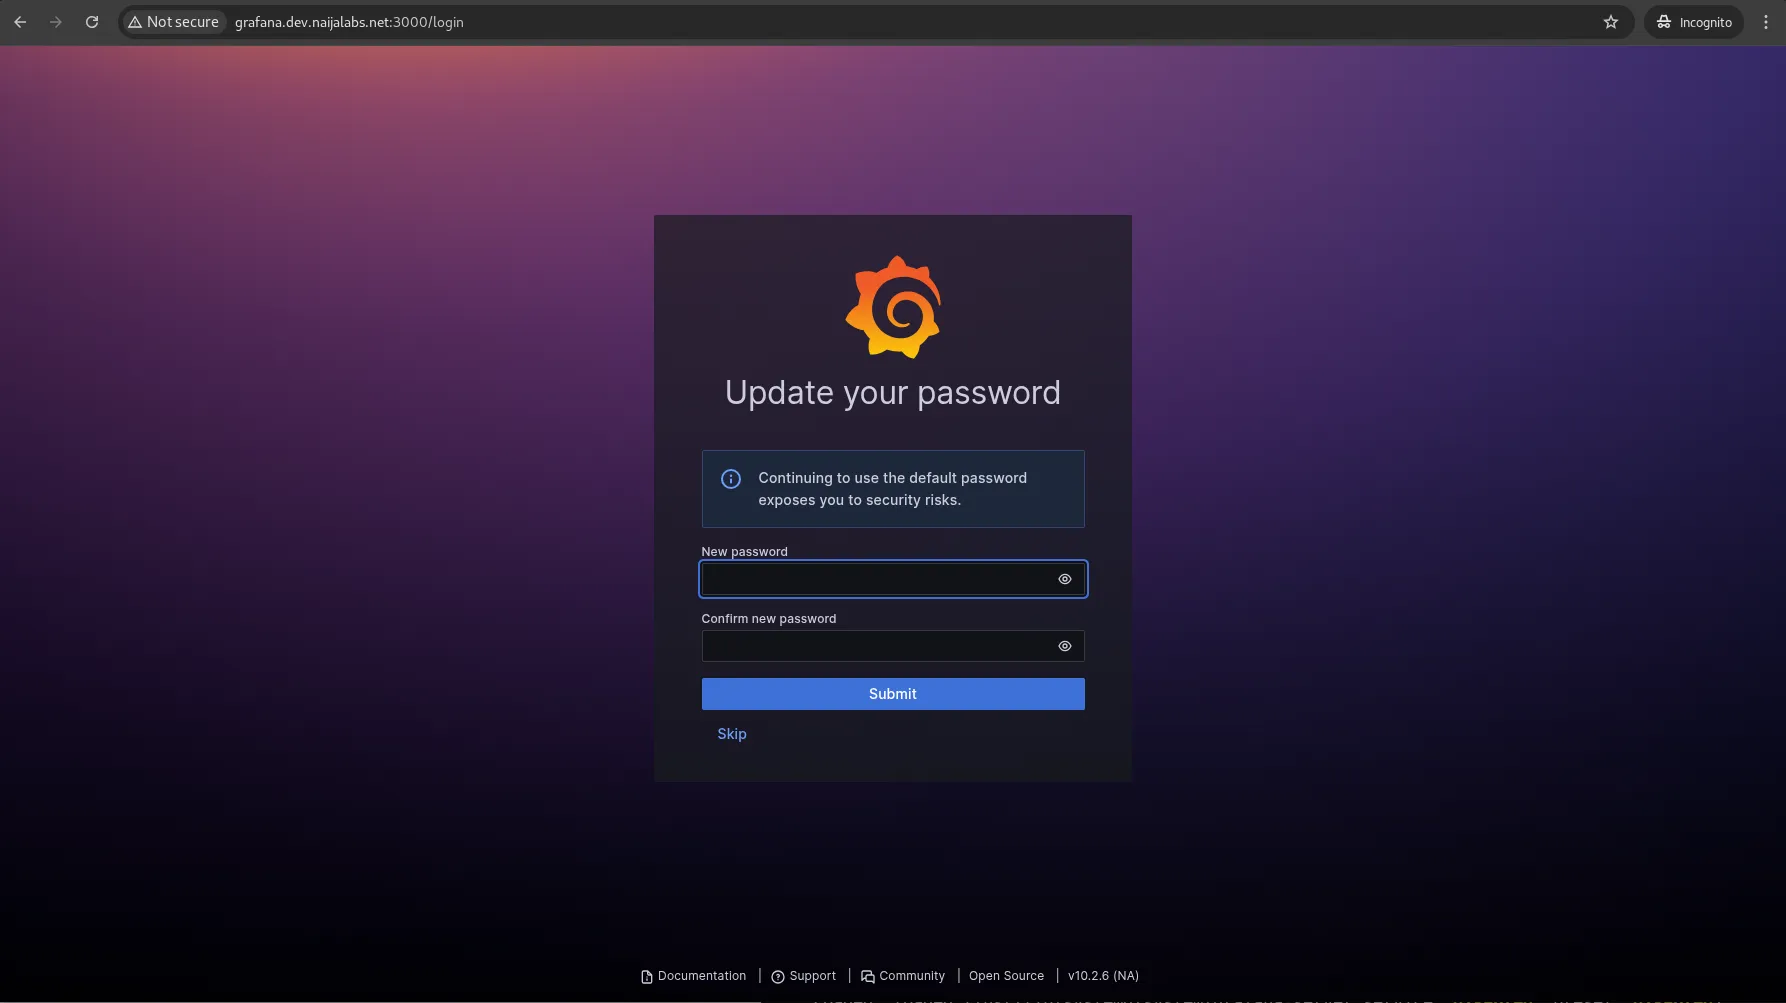
Photo by admingeek from Infotechys
After login, you’ll land on the Grafana UI. Some initial steps to consider:
|
|
|
|
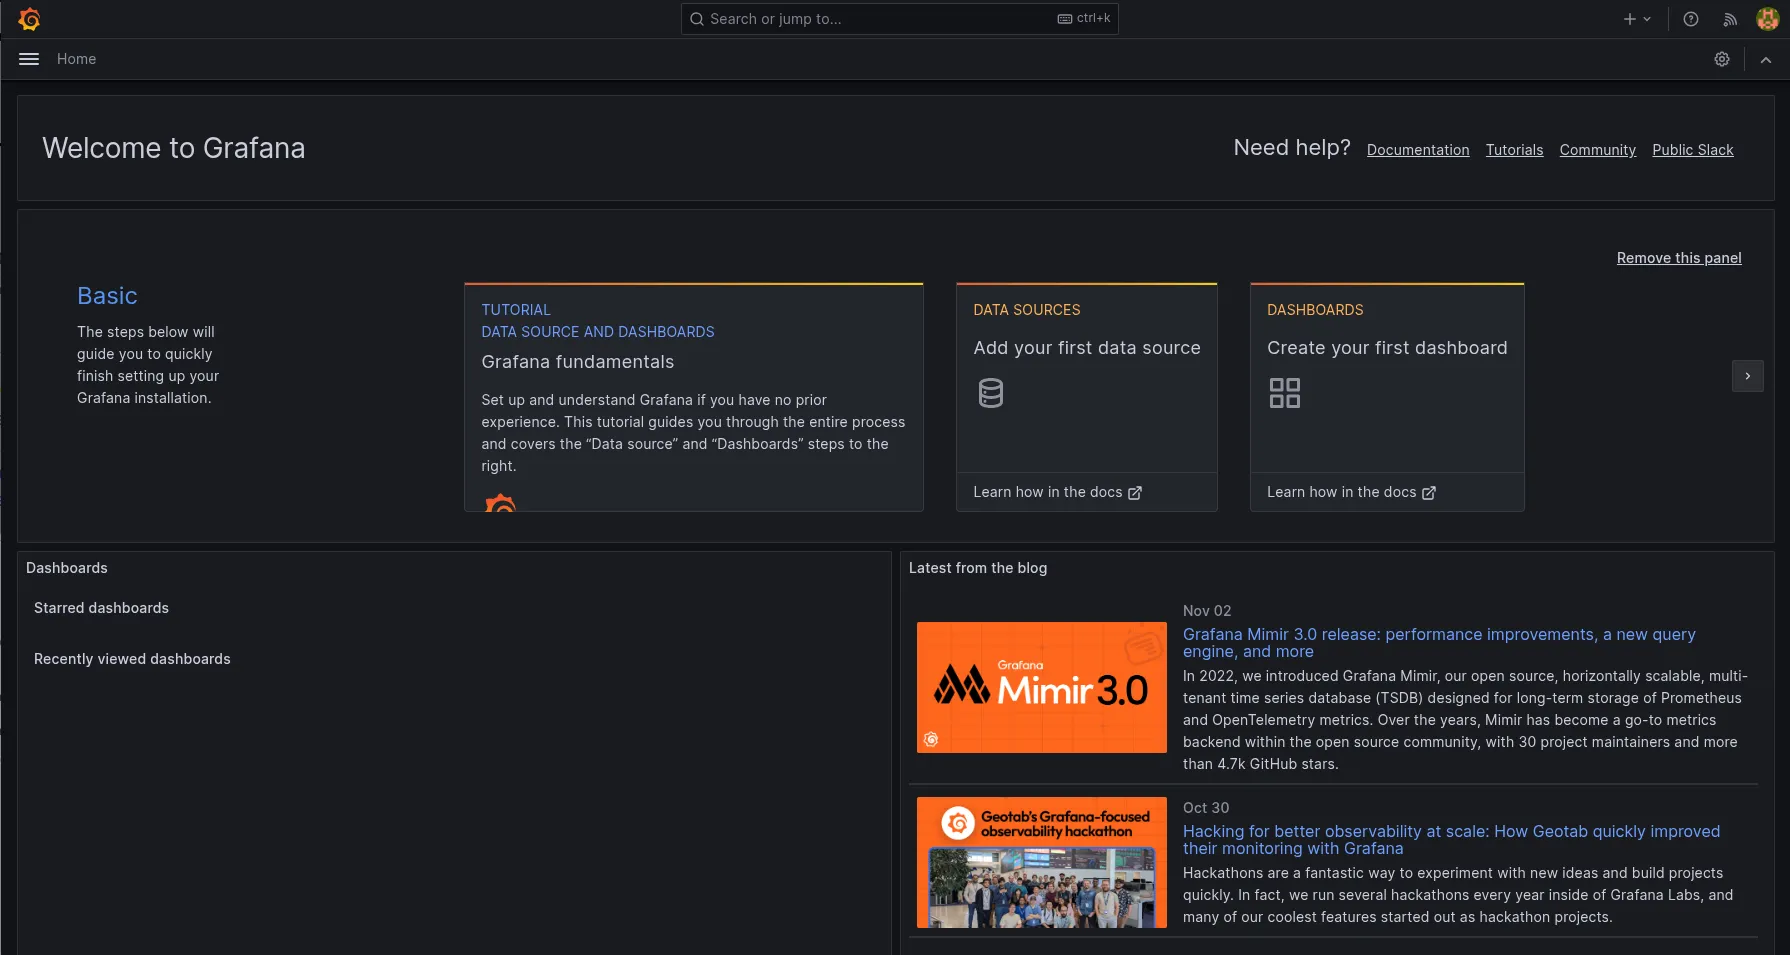
Photo by admingeek from Infotechys
⚡Tip: To change the default admin password via CLI |
sudo grafana-cli admin reset-admin-password NewP@sswordHere
For production usage, consider the following best practices:
|
					# nginx.conf

server {
    listen 443 ssl;
    server_name grafana.example.com;

    ssl_certificate /etc/ssl/certs/grafana.pem;
    ssl_certificate_key /etc/ssl/private/grafana.key;

    location / {
        proxy_pass http://127.0.0.1:3000;
        proxy_set_header Host $host;
        proxy_set_header X-Real-IP $remote_addr;
        proxy_set_header X-Forwarded-For $proxy_add_x_forwarded_for;
        proxy_set_header X-Forwarded-Proto $scheme;
    }
}
|
|
|
|
|
|
| Step | Action | Command / Location |
|---|---|---|
| 1 | Add Grafana repo | See commands under “Step 1” above |
| 2 | Install Grafana | sudo dnf install grafana |
| 3 | Start & enable service | sudo systemctl enable --now grafana-server |
| 4 | Open firewall port | sudo firewall-cmd --add-port=3000/tcp --permanent |
| 5 | Access web UI | http://<hostname>:3000 |
| 6 | Change default credentials | Use web UI or grafana-cli |
| 7 | Secure for production | Use reverse proxy + SSL, disable anonymous, etc |
|
|
|
|
By following this guide, you’ve configured a modern EL9 host (RHEL 9 or CentOS 9) with the official Grafana RPM repository, installed Grafana, started it, and performed the basic configuration steps. You’re now ready to connect data sources and build dashboards. The steps covered ensure you get a current version of Grafana, and the security tips help transition from proof-of-concept to production readiness.
Did you find this article helpful? Your feedback is invaluable to us! Feel free to share this post with those who may benefit, and let us know your thoughts in the comments section below.
This blog post covers how to install and configure Zabbix version 7.0-2 on RHEL 9 in detail, including prerequisites, step-by-step instructions, and troubleshooting tips. Table

Learn how to install Splunk on RHEL9 or CentOS 9 with this beginner-friendly guide. Step-by-step instructions, CLI examples, and troubleshooting tips included. Table of Contents

Learn how to install Zabbix with PostgreSQL on RHEL 9 | CentOS 9 with our comprehensive step-by-step guide. Follow clear instructions with CLI examples and