
Linux
In the ever-evolving landscape of IT infrastructure, one fundamental decision stands out when setting up storage solutions: choosing the right partitioning scheme. This article takes

Monitor and troubleshoot Linux disk I/O bottlenecks using iostat and iotop. Learn how to interpret %iowait, %util, await times and pinpoint heavy processes.
Efficient storage performance is critical to a responsive Linux system. When block I/O becomes a bottleneck, overall performance suffers—databases slow down, applications stall, and CPUs sit idle while waiting for disk operations. In this post we’ll walk through how to use the tools iostat and iotop (and related metrics such as “iowait” and disk %util) to monitor block I/O, pinpoint trouble spots, and interpret what the numbers really mean.
When your system shows high load or sluggish behavior, one common culprit is disk I/O bottlenecking. The “wait” in iowait refers to time when the CPU could be doing useful work, but instead is idle, waiting for I/O to complete. If you ignore this, you risk wasting high-end CPU or memory resources idling behind slow storage. Specific risks include:
|
|
|
Here is a quick reference table of key metrics you’ll encounter with iostat and top/iotop:
| Metric | Meaning & relevance |
|---|---|
%iowait | The CPU time spent waiting for I/O operations to complete. High values = storage bottleneck. |
%util (iostat) | Device utilization: percentage of time the device was handling I/O. Near 100% = device saturated. |
await | Average time (ms) for I/O requests to be served (includes queue + service). High await = latency issue. |
avgqu-sz or aqu-sz | Average queue length of I/O requests issued to device. > 1 may indicate saturation (depending on device). |
r/s and w/s | Read/write requests per second. Helps understand workload type. |
DISK READ / DISK WRITE (iotop) | Real-time per-process read/write throughput. Helps identify the culprit processes. |
▶️ Installing iostat |
On most Linux distributions, iostat is provided by the sysstat package. For example:
					# Debian/Ubuntu
sudo apt update && sudo apt install sysstat

# RHEL/CentOS
sudo yum install sysstat
▶️ Basic usage |
iostat -x -m 5 3
This command will display extended statistics (-x), in megabytes (-m), every 5 seconds, three times.
🖥️ Sample Output |
					Linux 4.18.0-553.82.1.el8_10.x86_64 (localhost.dev.naijalabs.net) 	11/10/2025 	_x86_64_	(2 CPU)

avg-cpu:  %user   %nice %system %iowait  %steal   %idle
           1.44    0.15    1.33    0.06    0.02   97.00

Device            r/s     w/s     rMB/s     wMB/s   rrqm/s   wrqm/s  %rrqm  %wrqm r_await w_await aqu-sz rareq-sz wareq-sz  svctm  %util
vda              0.69    0.77      0.01      0.02     0.00     0.10   0.11  11.54    3.24   76.46   0.06    14.14    30.04  12.45   1.83
dm-0             0.30    0.05      0.00      0.00     0.00     0.00   0.00   0.00    5.12   34.67   0.00    13.54    15.89   3.08   0.11
dm-1             0.00    0.00      0.00      0.00     0.00     0.00   0.00   0.00    0.91    0.00   0.00    21.35     0.00   0.77   0.00
dm-2             0.00    0.32      0.00      0.00     0.00     0.00   0.00   0.00    4.80   68.27   0.02    30.93     3.18  64.03   2.08
dm-3             0.36    0.18      0.01      0.02     0.00     0.00   0.00   0.00    1.19   92.33   0.02    14.50   111.08  30.45   1.65
dm-4             0.00    0.31      0.00      0.00     0.00     0.00   0.00   0.00    6.47   60.26   0.02    23.61     4.15  53.11   1.66
dm-5             0.02    0.00      0.00      0.00     0.00     0.00   0.00   0.00   10.27   60.39   0.00     3.19    56.16  12.54   0.02
...
From this output, you can see that device vda shows a moderate write latency (w_await ≈ 76.46 ms) and a low utilization rate (%util ≈ 1.83%). This suggests the disk is experiencing slight latency but is overall functioning normally. Such values are common immediately after a system reboot, when background services and applications are starting up. You should see these numbers gradually decrease in subsequent readings.
🔍 What to watch |
|
|
|
|
🔍 Interpreting results |
If you see something like:
|
|
Then you have a storage bottleneck, and you’ll want to move into per‐process monitoring to find what is causing it.
▶️ Installing iotop |
					# Debian/Ubuntu
sudo apt update && sudo apt install iotop

# RHEL/CentOS
sudo yum install iotop

# RHEL/CentOS version 8 or higher
sudo dnf install iotop
💡NOTE: You typically need root privileges to get full information. |
▶️ Basic usage |
sudo iotop
This presents an interactive display similar to top, but focusing on disk I/O.
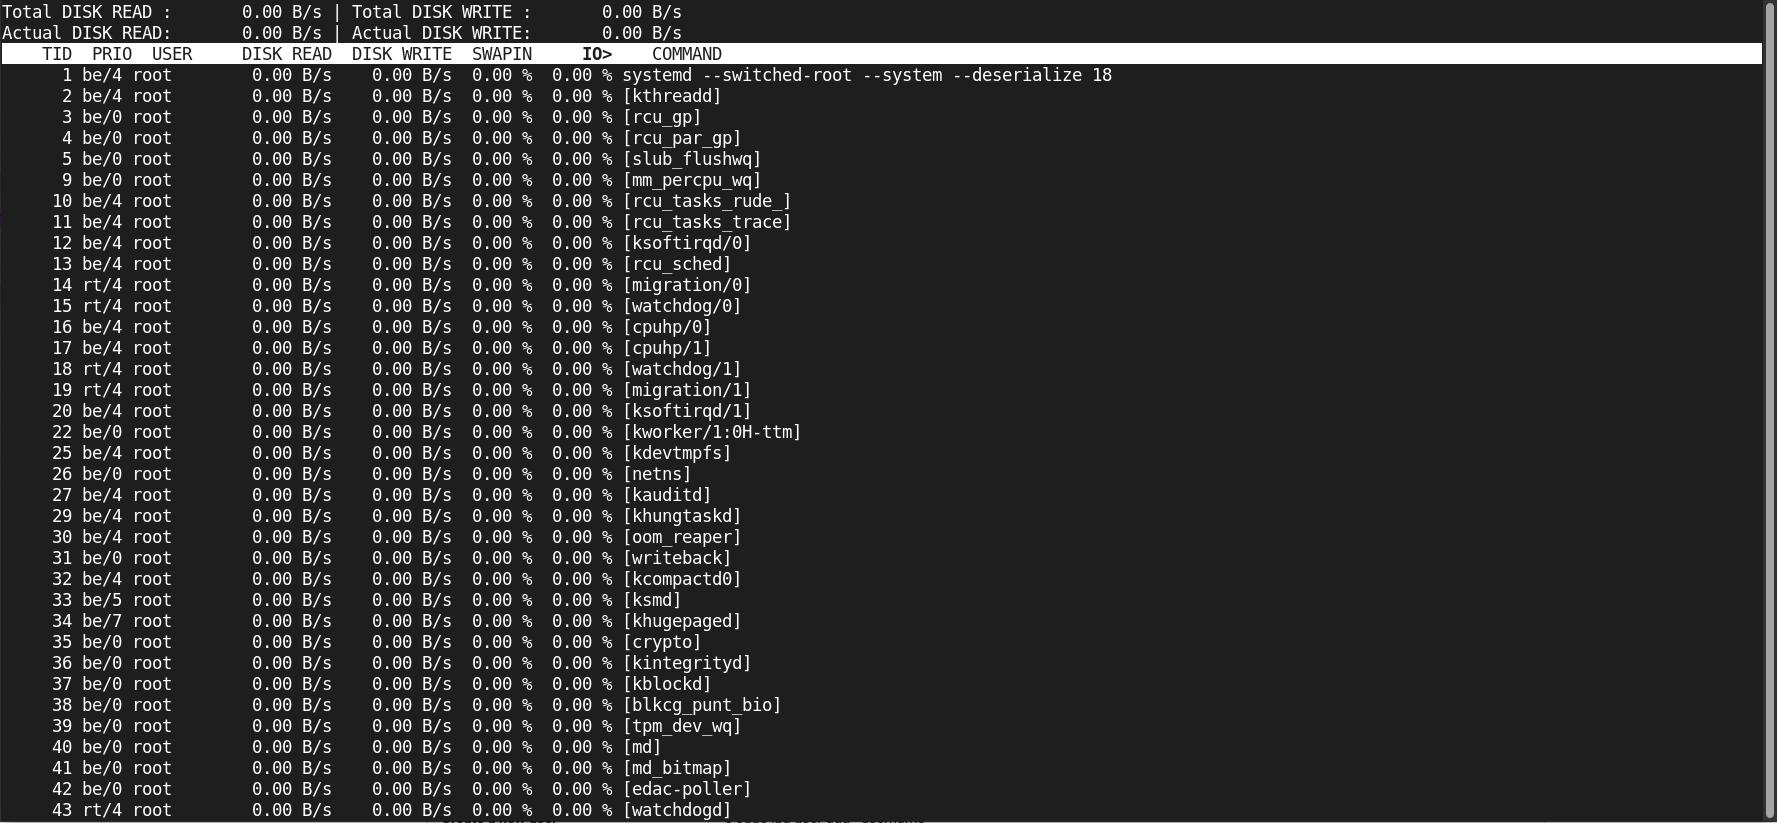
Photo by admingeek from Infotechys
🔍 Key columns to observe |
|
|
|
🔍 Useful flags |
|
|
sudo iotop -o
🖥️ Example output snippet |
					Total DISK READ :	0.00 B/s | Total DISK WRITE :       0.00 B/s
Actual DISK READ:	0.00 B/s | Actual DISK WRITE:       0.00 B/s
    TID  PRIO  USER     DISK READ  DISK WRITE  SWAPIN     IO>    COMMAND
      1 be/4 root        0.00 B/s    0.00 B/s  0.00 %  98.7 % some-backup-process
      2 be/4 root        0.00 B/s    0.00 B/s  0.00 %  0.00 % [kthreadd]
      3 be/0 root        0.00 B/s    0.00 B/s  0.00 %  0.00 % [rcu_gp]
Here you see the backup process is doing heavy writes and is almost entirely waiting on I/O (IO% nearly 100). That is your candidate to investigate further.
Here’s a typical workflow to track down disk wait issues.
🟢 Check overall system CPU/IO wait |
top
Look at %wa (iowait) column. If you see large numbers (> 10–20 %), storage may be the culprit.
🟢 Check device‐level view with iostat |
iostat -x 5 3
Look for high %util, high await, and non-zero queue sizes aqu-sz.
🟢 Identify the process doing heavy I/O with iotop |
sudo iotop -o
Sort by IO% or by DISK WRITE/READ; identify suspect process.
🟢 Decide remediation |
|
sudo ionice -c3 -p <PID>
This sets the process to idle I/O priority.
|
|
🟢 Monitor over time |
Consider capturing these metrics periodically (via cron + iostat, iotop -b, or other monitoring tool) and graph trends. Persistent high await or util signals a long-term issue.
| Metric | Good range (SSD) | Good range (HDD/RAID) | Trouble sign |
|---|---|---|---|
%iowait | < 5% | < 10% | > 20% sustained |
Device %util | < 70% | < 70% | > 90% sustained |
await (ms) | < 5 ms | < 20 ms | > 50–100+ ms |
avgqu-sz | < 1 | < 1–2 | > 2, with high util |
| Per-process IO% (iotop) | low unless heavy task | ditto | ~100% stuck waiting |
💡NOTE: Thresholds vary by workload and device type. These are general guidelines. |
Let’s walk through a hypothetical scenario:
You notice your web server is slow. top shows %wa around 30%. You run iostat -x 5 3 and observe:
					Device   r/s  w/s  r_await  w_await  %util
sda      8    102  12.3     345.2    98.7
💡Interpretation: Writes are queuing deeply ( |
You fire sudo iotop -o and see:
					PID  USER    DISK WRITE  IO%   COMMAND
9876 backup  60.2 MB/s   95%   nightly-backup
💡Remediation path: the nightly-backup process is hogging disk; options are to reschedule it to off-peak, throttle I/O (via |
|
|
|
|
|
|
Monitoring block I/O and disk wait times is a vital part of system performance management. By combining device-level metrics (iostat) and process-level insight (iotop), you can determine whether your storage subsystem is a bottleneck, identify the offending workloads, and take corrective action. Remember to monitor proactively, interpret key metrics (%iowait, %util, await, aqu-sz), and use process-level tools to drill down into root causes. With the right data and response, you can keep your storage system—and by extension your applications—running smoothly and responsively.
Did you find this article helpful? Your feedback is invaluable to us! Feel free to share this post with those who may benefit, and let us know your thoughts in the comments section below.
In the ever-evolving landscape of IT infrastructure, one fundamental decision stands out when setting up storage solutions: choosing the right partitioning scheme. This article takes

Learn how to manage GPT and MBR partitions in Linux using powerful CLI tools like fdisk, gdisk, and parted. This guide covers creating, deleting, resizing,

Discover 25 essential Linux commands for efficient storage management. Learn how to monitor disk usage, manage partitions, create filesystems, and optimize storage performance with detailed