Scientific computing using Python refers to the use of the Python programming language and its associated libraries to solve scientific problems. Scientific computing is the

In this article, we will learn how to install Python Matplotlib on CentOS9 or RHEL9, a popular tool for scientific computing and data manipulation.
Matplotlib is a Python library used for creating visualizations and plots in data analysis, scientific computing, and machine learning. In this article, we will discuss how to install Matplotlib on RHEL9 or CentOS9.
Matplotlib was created by John D. Hunter in 2003 as an open-source library for creating high-quality scientific visualizations in Python. It is built on top of the NumPy library and provides a range of 2D and 3D plots and visualizations. Matplotlib has become a standard library for scientific computing and data analysis.
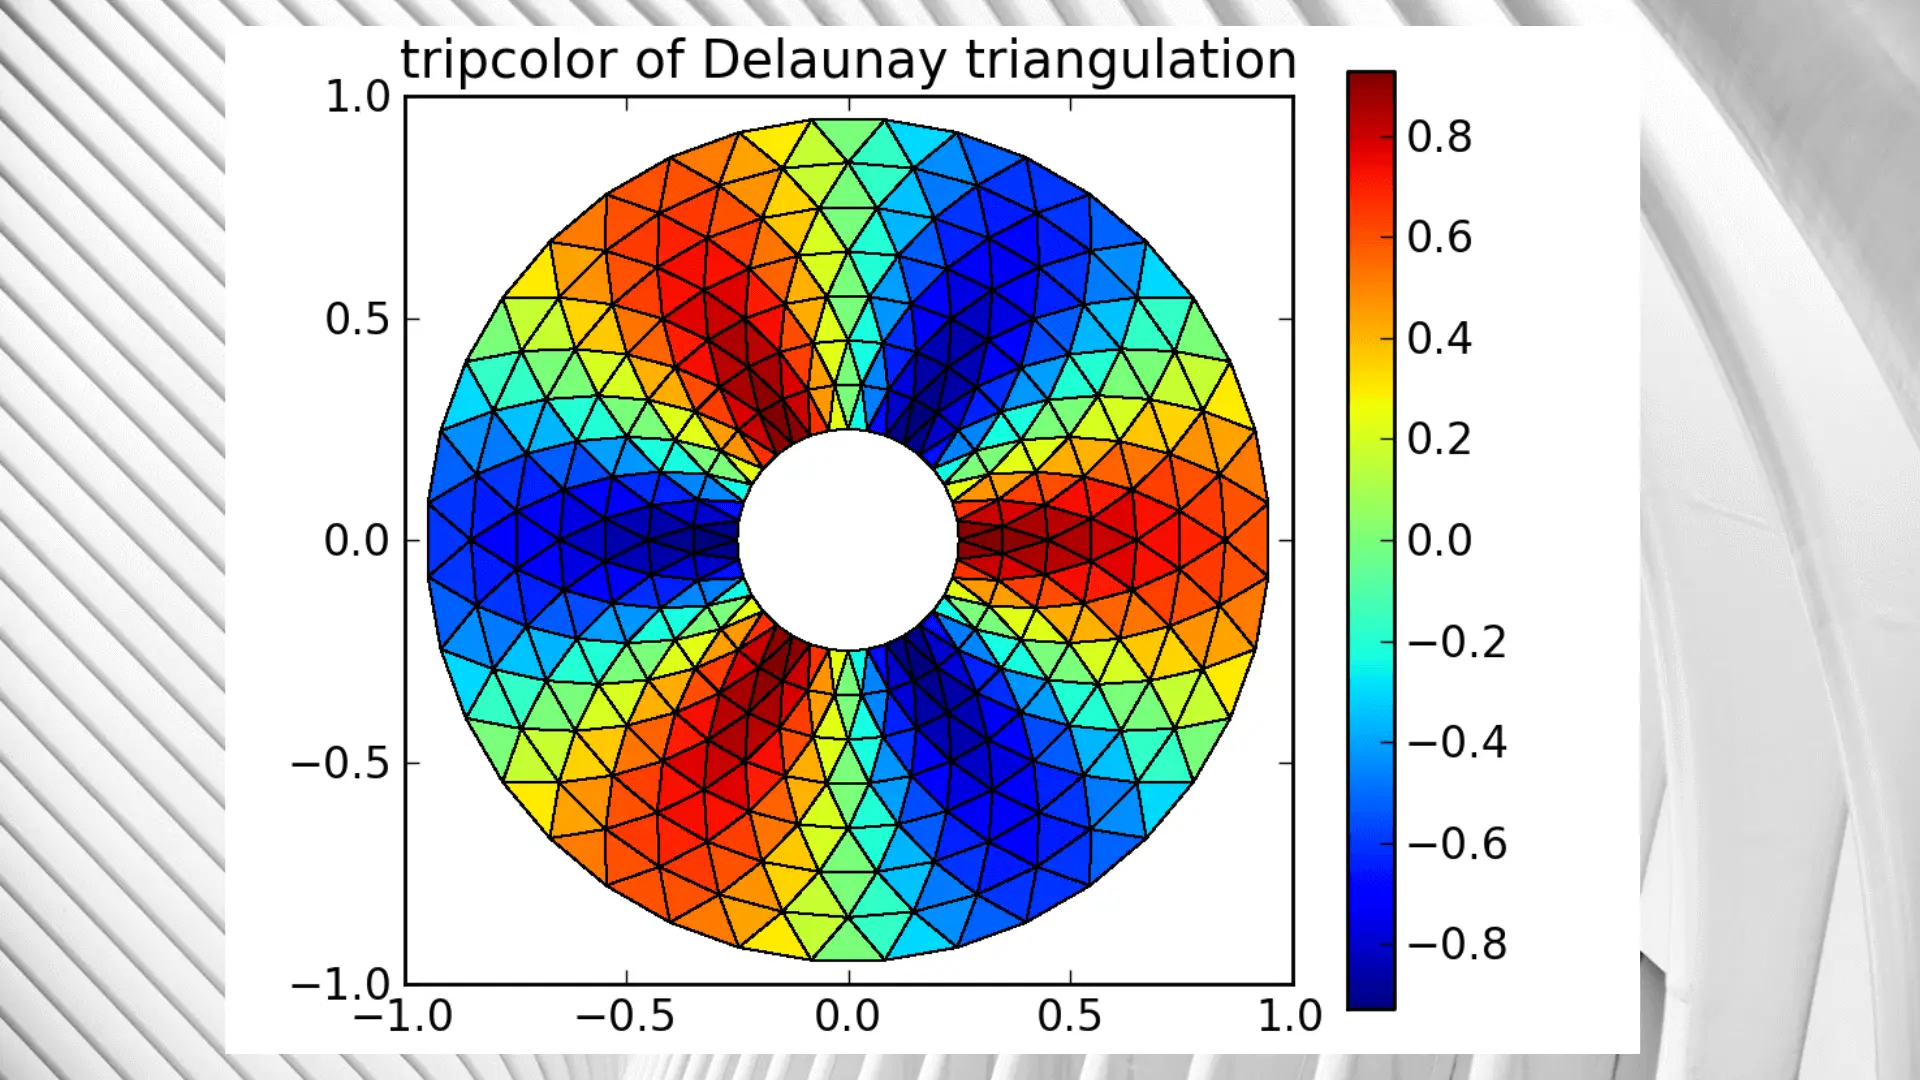
Matplotlib is a Python library that provides support for creating 2D and 3D plots and visualizations. It provides a range of visualization tools and plot types, including scatter plots, line plots, bar plots, and histograms. Matplotlib is built on top of the NumPy library and provides a range of customization options to create high-quality visualizations.

Image credit: community.linuxmint.com
The following steps will guide you on how to install Matplotlib on RHEL9 or CentOS9.
Before we begin, it’s always a good practice to update the system to the latest version. Run the following command to update the system:
$ sudo dnf update -y
Matplotlib can be installed using pip, which is a package installer for Python. Run the following command to install pip:
$ sudo dnf install python3-pip
Now that pip is installed, we can use it to install Matplotlib. Run the following command to install Matplotlib:
$ pip3 install matplotlib
To verify that Matplotlib is installed, open the Python interpreter by running the following command:
					$ python3
Python 3.9.16 (main, Dec  8 2022, 00:00:00)
[GCC 11.3.1 20221121 (Red Hat 11.3.1-4)] on linux
Type "help", "copyright", "credits" or "license" for more information.
>>>
Once you are in the Python interpreter, import Matplotlib by running the following command:
					$ python3
Python 3.9.16 (main, Dec  8 2022, 00:00:00)
[GCC 11.3.1 20221121 (Red Hat 11.3.1-4)] on linux
Type "help", "copyright", "credits" or "license" for more information.

>>> import matplotlib.pyplot as plt
If there are no errors, Matplotlib is successfully installed.
Here are some best practices that you should follow when using Matplotlib:
In this article, we discussed how to install Matplotlib on RHEL9 or CentOS9. Matplotlib is a powerful Python library for creating visualizations and plots in scientific computing, data analysis, and machine learning. By following the installation procedure and best practices, you can start creating high-quality visualizations in your projects.
Was this article helpful to you? If so, leave us a comment below. We’d love to hear from you!
Related Posts

Scientific computing using Python refers to the use of the Python programming language and its associated libraries to solve scientific problems. Scientific computing is the

In this article, we will learn how to install Python NumPy on CentOS9 or RHEL9, the essential package for scientific computing and data manipulation! Table

If you’re looking for a powerful and flexible environment to perform scientific computing and data analysis, learning “How to Use Linux for Scientific Computing and
