
Commands
In this article, we will review the top 50 Linux commands every Linux Sysadmin should know. Junior-level sysadmins and Linux enthusiasts are familiar with all

Explore 20 commonly used SPL commands in Splunk, with example queries for stats, timechart, eval, eventstats, streamstats, rex, and more. Boost your Splunk search skills and write better dashboards and alerts.
If you’re learning Splunk or even if you’ve been using it a while, knowing the right SPL (Search Processing Language) commands can dramatically increase your efficiency, reduce time-to-insight, and help you write cleaner, faster searches. Below are 20 of the most commonly used SPL commands—what they do, when to use them, and real examples to illustrate each. Use these to level up your Splunk skills (and get your dashboards, alerts, and investigations running smoother).
Below is a table summarizing the commands with short descriptions. After that, each command is explained with example SPL (CLI style) usage.
| # | Command | Brief Description |
|---|---|---|
| 1 | search | Filter by index, field, keyword; foundational command. |
| 2 | fields | Select which fields to include or exclude. |
| 3 | table | Display results in tabular form with specified columns. |
| 4 | top / rare | Show most common or least common values for a field. |
| 5 | stats | Aggregate data with count, sum, avg, etc. |
| 6 | timechart | Time-based statistical charting over intervals. |
| 7 | chart | Multi-dimensional statistical summaries (non-time). |
| 8 | eval | Compute new fields, conditionals, rename values etc. |
| 9 | where | Filter events based on computed or existing fields. |
| 10 | rex | Extract fields via regex. |
| 11 | spath | Extract fields from JSON / XML or nested data. |
| 12 | lookup | Enrich events using external lookup tables. |
| 13 | transaction | Group events into transactions (sessions, flows, etc.). |
| 14 | eventstats | Add aggregated statistics to each event without collapsing the result. |
| 15 | streamstats | Generate running totals, moving averages, cumulative stats etc. |
| 16 | sort / dedup | Order results or remove duplicate events. |
| 17 | bin | Bucket numeric values or timestamps into intervals. |
| 18 | join | Combine main search results with subsearch results based on matching fields. |
| 19 | append / appendcols | Combine or append subsearch results in different ways. |
| 20 | head / tail | Keep only the first or last N results. |
Here are practical SPL examples you can copy or adapt.
🔄 1. |
Filters events by index, sourcetype, or specific field conditions.
index=main sourcetype=apache_access status=404
Or explicitly:
search index=main "error" OR status=500
🔄 2. |
Reduces noise by limiting which fields are returned in the result set.
index=main sourcetype=syslog | fields _time host user message
You can also exclude:
index=main | fields - raw _indextime
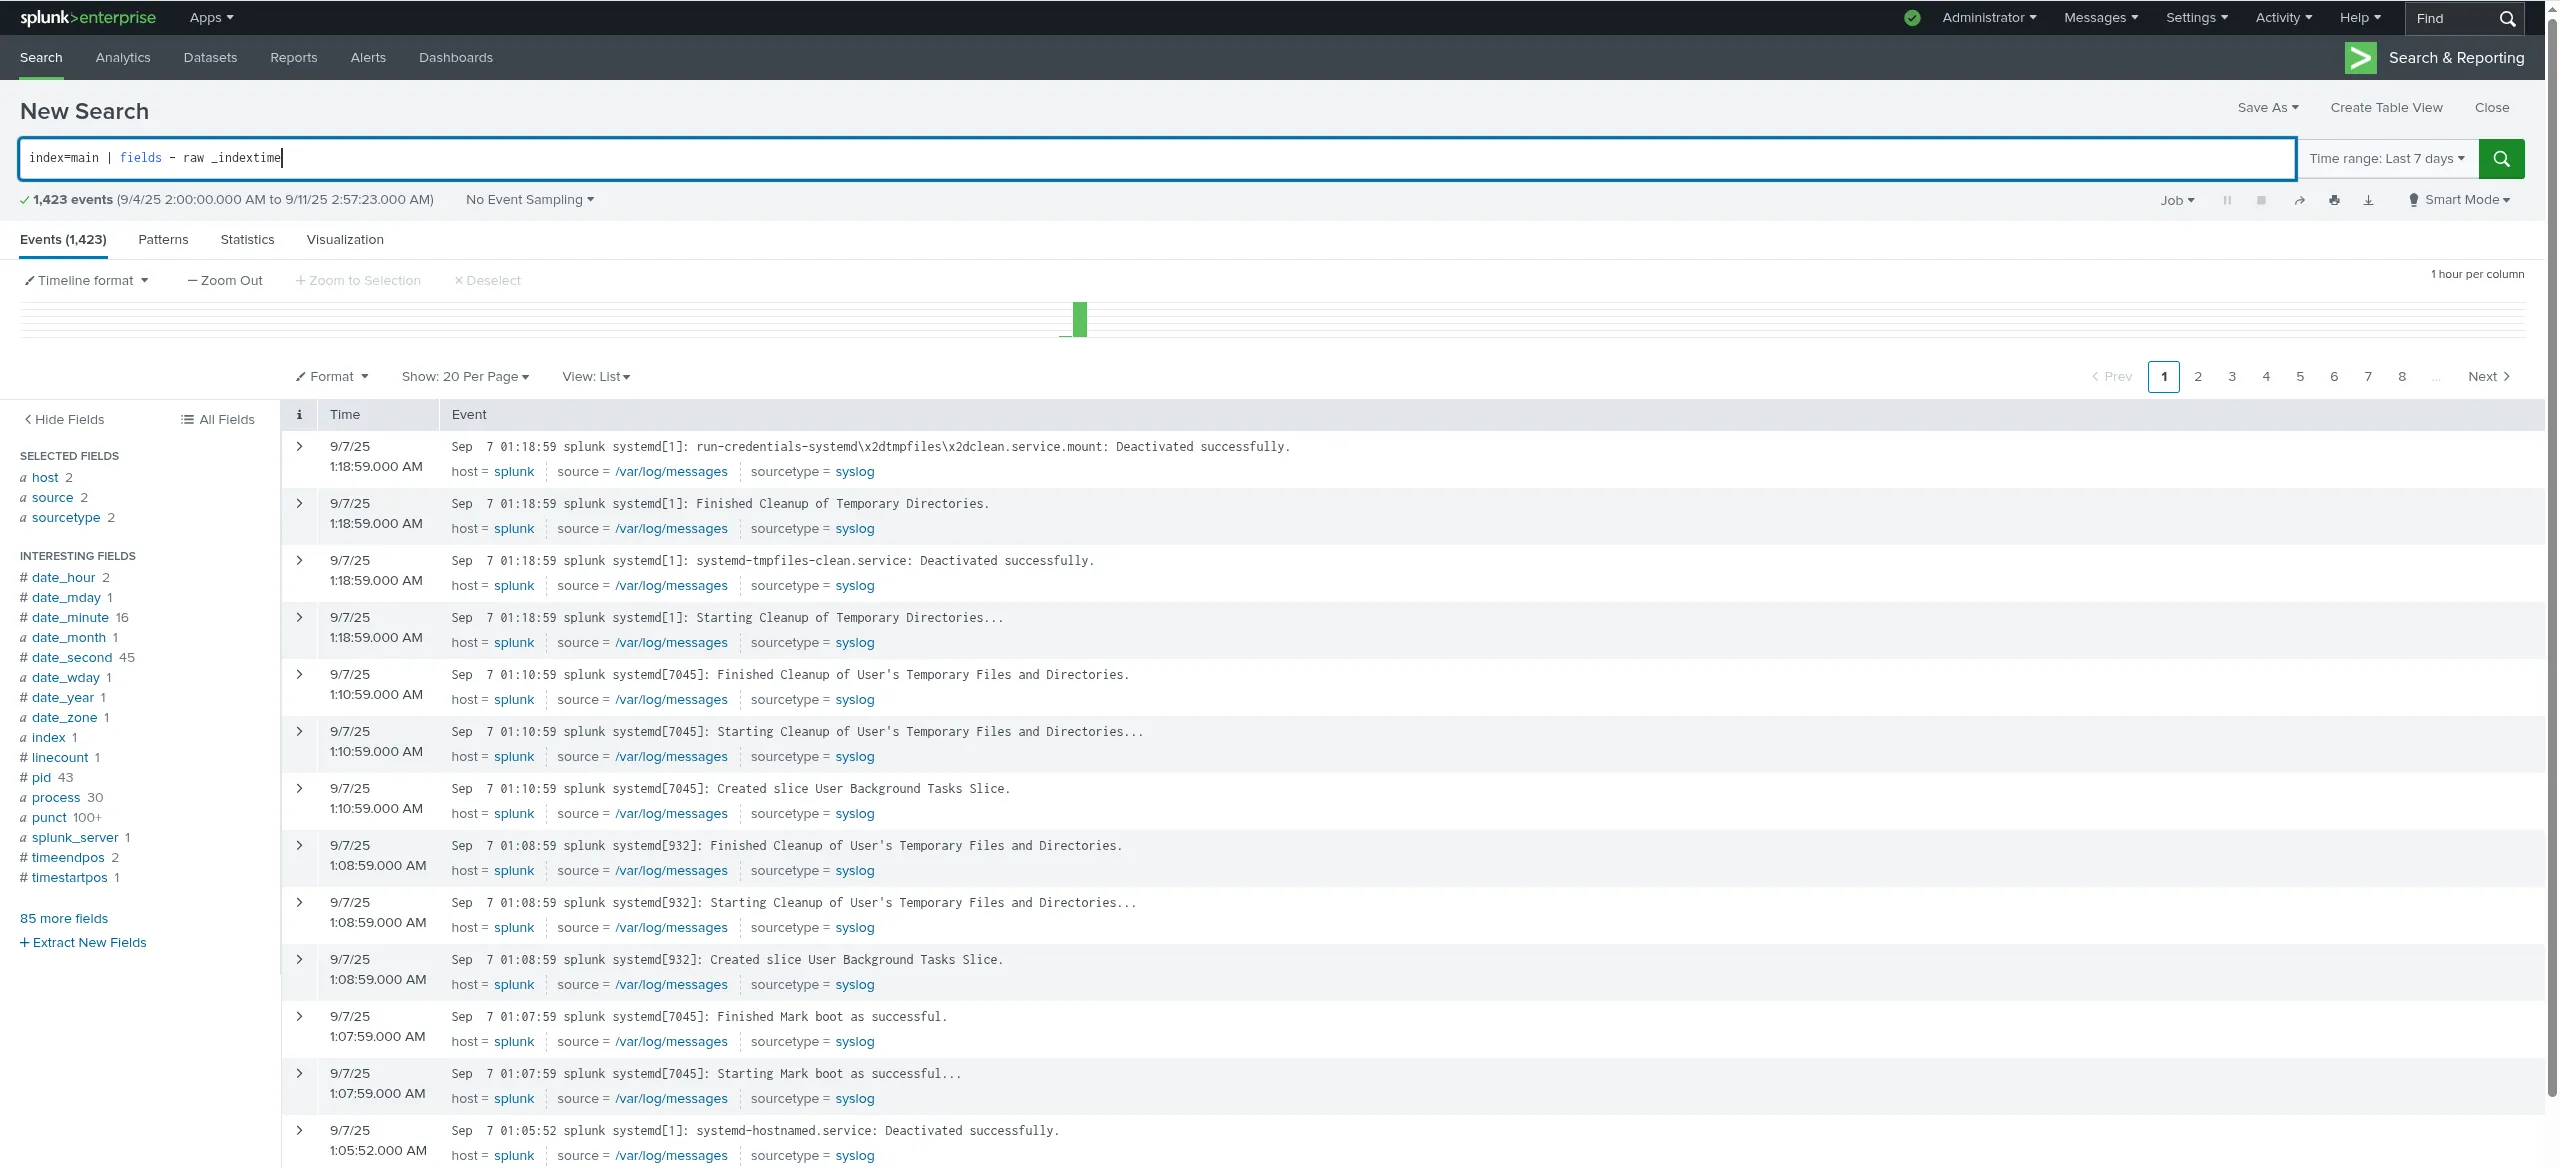
Photo by admingeek from Infotechys
🔄 3. |
Generate a clean tabular layout for dashboards or reports:
index=auth_logs | where action="failure" | table _time user src_ip reason
🔄 4. |
Find frequent or infrequent values — often used in troubleshooting or outlier detection.
index=web_logs | top clientip
index=web_logs | rare status
🔄 5. |
One of the most powerful transforming commands.
index=web_logs | stats count by status
index=transactions | stats sum(amount) as total_amount, avg(amount) as avg_amount by customer_id
🔄 6. |
Useful for timeseries trends, dashboard panels.
index=web_logs | timechart span=1h count by status
index=transactions | timechart span=30m sum(amount) as sales
🔄 7. |
For non-time grouped summaries, e.g., counts over two dimensions:
index=web_logs | chart count over status by method
🔄 8. |
Create new fields, do conditional logic, do math operations, string functions, etc.
index=web_logs | eval is_error = if(status>=500, "yes", "no")
Combine with math:
... | eval response_time_ms = latency * 1000
🔄 9. |
Filter after evaluation, using field values or expressions:
index=transactions | eval pct_above_avg = amount / avg(amount) * 100 | where pct_above_avg > 150
💡NOTE: |
🔄 10. |
Extract pieces of raw data with regex, name capturing groups:
index=web_logs | rex field=_raw "user=(?<user>\w+)"
... | rex field=uri_path "/products/(?<product_id>\d+)/"
🔄 11. |
Great for JSON or XML payloads; extract nested fields cleanly.
index=json_logs | spath input=body path=user.id output=user_id
... | spath output=profile.name path=profile.details.name
🔄 12. |
Enrich your events from external/static tables (CSV, KV store, etc.)
index=main | lookup dns_lookup clientip AS src_ip OUTPUT domain
... | lookup user_info username OUTPUT display_name role
🔄 13. |
Group related events into a logical unit, often based on shared fields and time windows.
					index=web_logs sourcetype=security_event action in ("login","logout")
| transaction user maxspan=30m
🔄 14. |
Unlike stats, it preserves original events but adds aggregated info.
From Splunk docs:
💡eventstats generates aggregations and adds them as a new field to each event. |
index=web_logs | eventstats avg(bytes) AS avg_bytes
index=web_logs | eventstats sum(bytes) AS total_bytes BY clientip
Then you can compare each event’s bytes to average or total.
🔄 15. |
Running / streaming statistics — cumulative sums, moving averages, or between consecutive events.
index=web_logs | sort _time | streamstats sum(bytes) as cumulative_bytes by clientip
✋Use case: to see how much a given IP has sent over time up to each event. |
🔄 16. |
|
index=web_logs | sort - bytes
|
index=web_logs | dedup clientip
🔄 17. |
Group or bucket numeric or timestamp fields into intervals:
index=web_logs | bin span=5m _time
Often used before chart or timechart for coercing into buckets.
🔄 18. |
Combine search results with another search (subsearch) keyed by common field(s):
					index=web_logs status=404
| join host [ search index=web_logs status=500 | stats count by host ]
| table host count
🛑 Be cautious: joins can be expensive. Use sparingly or with limits. |
🔄 19. |
|
index=web_logs error | append [ search index=web_logs warning ]
|
🔄 20. |
Only want the first or last N events.
index=web_logs | head 10
index=web_logs | tail 5
|
|
|
|
|
Here are two combined examples showing how multiple SPL commands work together.
🔹 Example A: Monitoring error spike per host |
					index=app_logs error
| stats count AS error_count by host
| timechart span=1h sum(error_count) AS total_errors by host
This gives you an hourly view per host of how many errors are appearing.
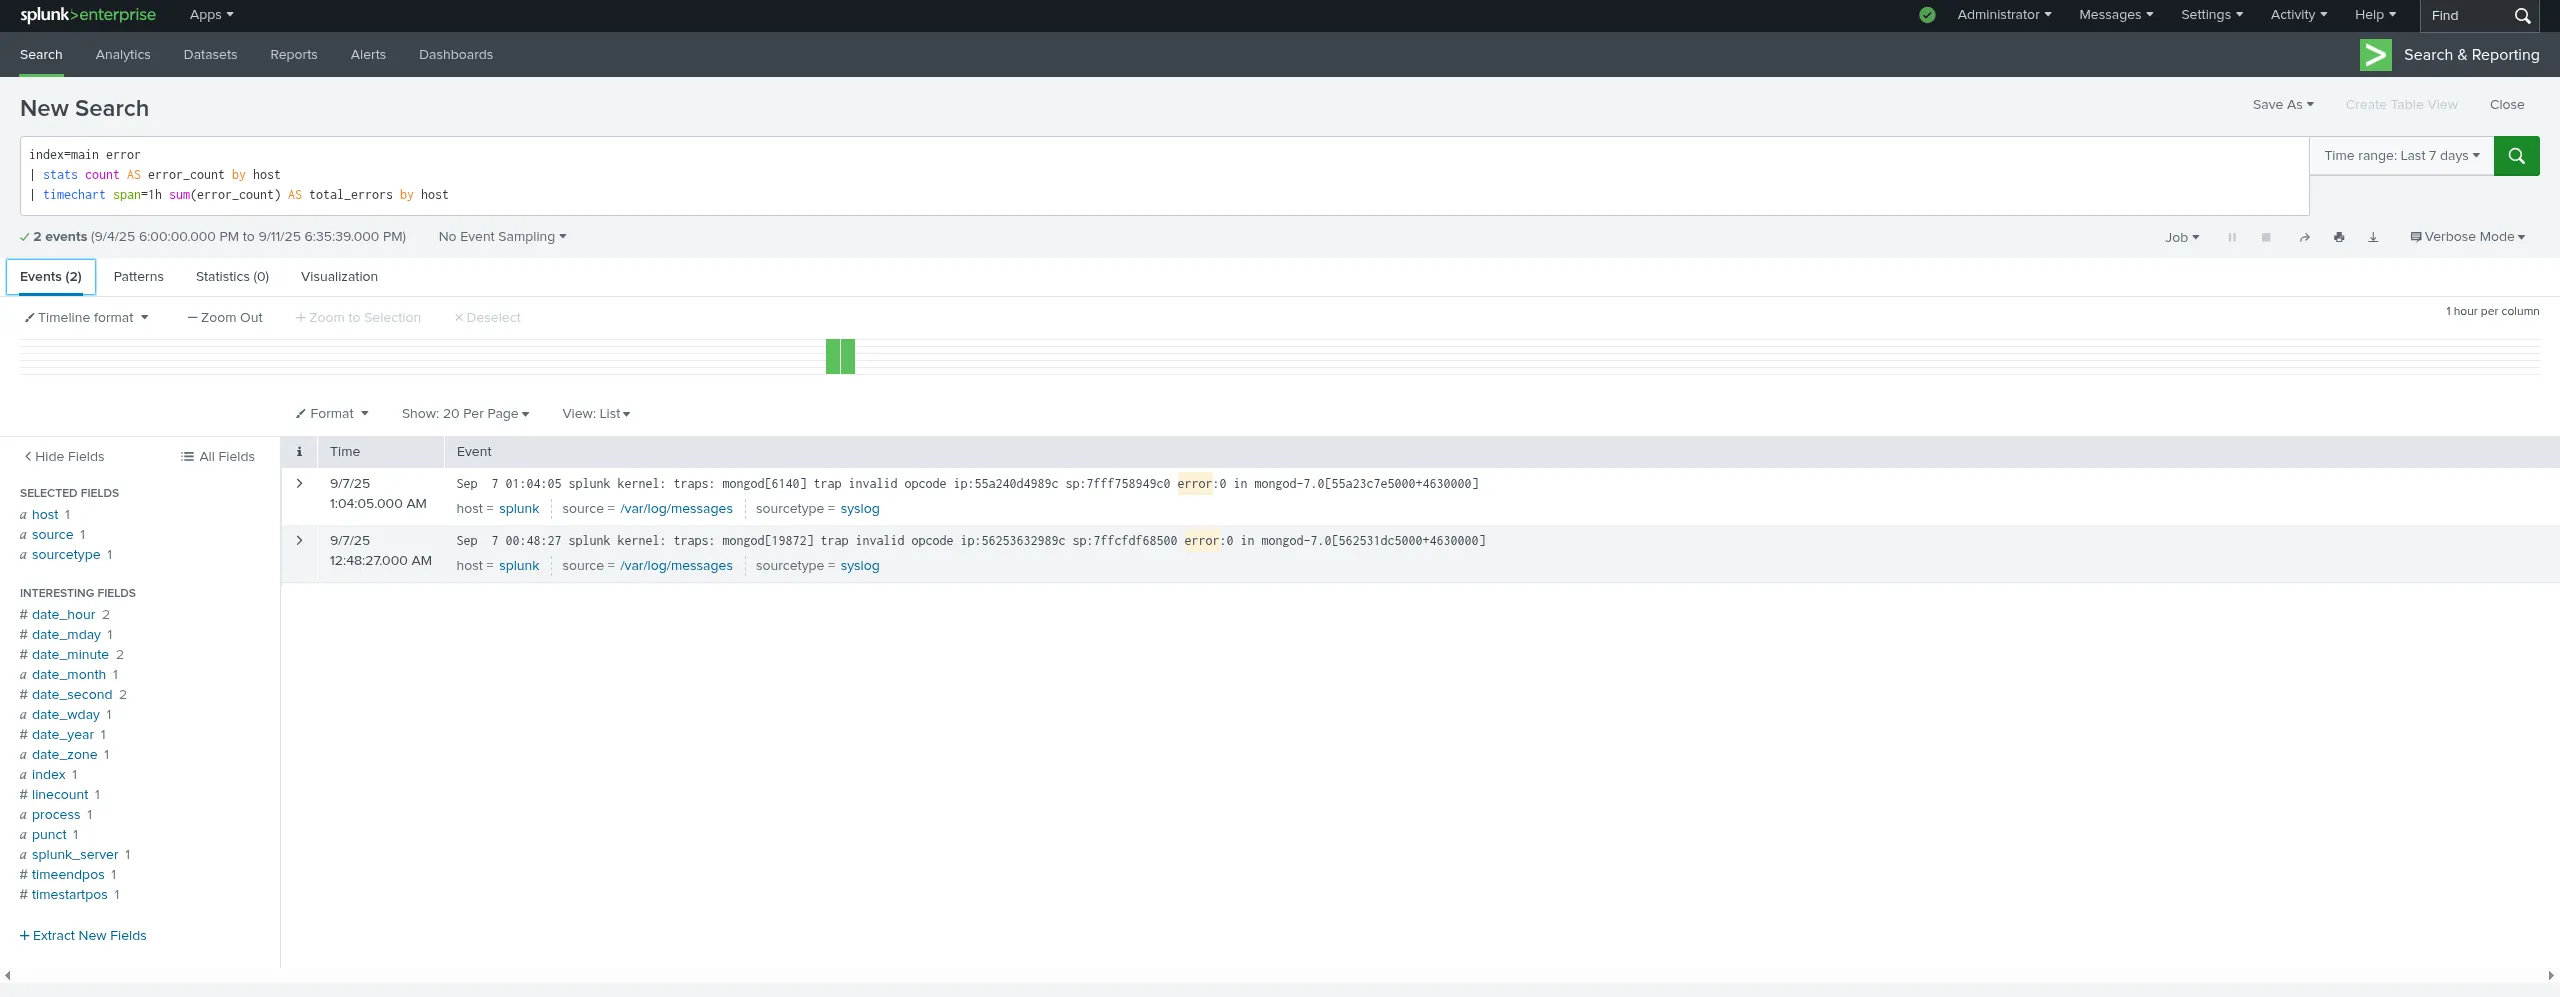
Photo by admingeek from Infotechys
🔹 Example B: Detecting unusual behavior vs baseline |
					index=traffic_logs
| stats avg(bytes) AS avg_bytes BY src_ip
| eventstats global_avg = avg(avg_bytes)
| where avg_bytes > global_avg * 2
| table src_ip avg_bytes global_avg
|
|
|
| Scenario | Best SPL command(s) |
|---|---|
| Filter data by keyword / field values | search, where |
| Clean up output fields | fields, table |
| Extract nested or raw data | rex, spath |
| Aggregate for metrics / counts | stats, timechart, chart |
| Add context (baseline / running totals) | eventstats, streamstats |
| Structure events into sessions or logical units | transaction |
| Combine additional datasets | lookup, join, append |
| Limit results for dashboards or previews | head, tail, dedup, sort |
Mastering these 20 SPL commands will make you much more effective in writing searches, building dashboards, troubleshooting, and detecting anomalies. As you work more in Splunk, you’ll develop instincts about when to use a streaming command vs transforming vs generating, and how to combine them in the most efficient way.
Did you find this article helpful? Your feedback is invaluable to us! Feel free to share this post with those who may benefit, and let us know your thoughts in the comments section below.
In this article, we will review the top 50 Linux commands every Linux Sysadmin should know. Junior-level sysadmins and Linux enthusiasts are familiar with all

Learn how to configure SSL for Splunk Enterprise on RHEL 9 or CentOS 9. This detailed guide covers certificate generation, secure web interface setup, and

Unlock the full potential of file management in Linux with our comprehensive guide featuring 20 practical find command examples. From searching by name, type, size,